Polygenic score
In genetics, a polygenic score, also called a polygenic risk score (PRS), genetic risk score, or genome-wide score, is a number that summarises the estimated effect of many genetic variants on an individual's phenotype, typically calculated as a weighted sum of trait-associated alleles.[1][2][3] It reflects an individuals estimated genetic predisposition for a given trait and can be used as a predictor for that trait.[4][5][6][7][8] Polygenic scores are widely used in animal breeding and plant breeding (usually termed genomic prediction or genomic selection) due to their efficacy in improving livestock breeding and crops.[9] They are also increasingly being used for risk prediction in humans for complex diseases[10] which are typically affected by many genetic variants that each confer a small effect on overall risk.[11][12]
History

One of the first precursors to the modern polygenic score was proposed under the term marker-assisted selection (MAS) in 1990.[14] According to MAS, breeders are able to increase the efficiency of artificial selection by estimating the regression coefficients of genetic markers that are correlated with differences in the trait of interest and assigning individual animals a "score" from this information. A major development of these fundamentals was proposed in 2001 by researchers who discovered that the use of a Bayesian prior could help to mitigate the problem of the number of markers being greater than the sample of animals.[15]
These methods were first applied to humans in the late 2000s, starting with a proposal in 2007 that these scores could be used in human genetics to identify individuals at high risk for disease.[16] This was successfully applied in empirical research for the first time in 2009 by researchers who organized a genome-wide association study (GWAS) of schizophrenia to construct scores of risk propensity. This study was also the first to use the term polygenic score for a prediction drawn from a linear combination of single-nucleotide polymorphism (SNP) genotypes, which was able to explain 3% of the variance in schizophrenia.[17]
Methods of construction
A polygenic score (PGS) is constructed from the "weights" derived from a genome-wide association study (GWAS). In a GWAS, a set of genetic markers (usually SNPs) is genotyped on a training sample, and effect sizes are estimated for each marker's association with the trait of interest. These weights are then used to assign individualized polygenic scores in an independent replication sample.[1] The estimated score, , generally follows the form

- ,

where the of an individual is equal to the weighted sum of the individual's marker genotypes, , at SNPs.[1] Weights are estimated using some form of regression analysis. Because the number of genomic variants is usually larger than the sample size, one cannot use OLS multiple regression (p > n problem[18][19]). Researchers have proposed various methodologies that deal with this problem as well as how to generate the weights of the SNPs, , and how to determine which SNPs should be included.


Pruning and thresholding
The simplest so-called "pruning and thresholding" method of construction sets weights equal to the coefficient estimates from a regression of the trait on each genetic variant. The included SNPs may be selected using an algorithm that attempts to ensure that each marker is approximately independent. Failing to account for non-random association of genetic variants will typically reduce the score's predictive accuracy. This is important because genetic variants are often correlated with other nearby variants, such that the weight of a causal variant will be attenuated if it is more strongly correlated with its neighbors than a null variant. This is called linkage disequilibrium, a common phenomenon that arises from the shared evolutionary history of neighboring genetic variants. Further restriction can be achieved by multiple-testing different sets of SNPs selected at various thresholds, such as all SNPs which are genome-wide statistically-significant hits or all SNPs p < 0.05 or all SNPs with p < 0.50, and the one with greatest performance used for further analysis; especially for highly polygenic traits, the best polygenic score will tend to use most or all SNPs.[20]
Bayesian methods
Bayesian approaches, originally pioneered in concept in 2001,[15] attempt to explicitly model preexisting genetic architecture, thereby accounting for the distribution of effect sizes with a prior that should improve the accuracy of a polygenic score. One of the most popular modern Bayesian methods uses "linkage disequilibrium prediction" (LDpred for short) to set the weight for each SNP equal to the average of its posterior distribution after linkage disequilibrium has been accounted for. LDpred tends to outperform simpler methods of pruning and thresholding, especially at large sample sizes; for example, its estimations have improved the predicted variance of a polygenic score for schizophrenia in a large data set from 20.1% to 25.3%.[8]
Penalized regression
Penalized regression methods, such as LASSO and ridge regression, can also be used to improve the accuracy of polygenic scores. Penalized regression can be interpreted as placing informative prior probabilities on how many genetic variants are expected to affect a trait, and the distribution of their effect sizes. In other words, these methods in effect "penalize" the large coefficients in a regression model and shrink them conservatively. Ridge regression accomplishes this by shrinking the prediction with a term that penalizes the sum of the squared coefficients.[4] LASSO accomplishes something similar by penalizing the sum of absolute coefficients.[21] Bayesian counterparts exist for LASSO and ridge regression, and other priors have been suggested and used. They can perform better in some circumstances.[22] A multi-dataset, multi-method study[19] found that of 15 different methods compared across four datasets, minimum redundancy maximum relevance was the best performing method. Furthermore, variable selection methods tended to outperform other methods. Variable selection methods do not use all the available genomic variants present in a dataset, but attempt to select an optimal subset of variants to use. This leads to less overfitting but more bias (see bias-variance tradeoff).
Predictive performance
The benefit of polygenic scores is that they can be used to predict the future for crops, animal breeding, and humans alike. Although the same basic concepts underlie these areas of prediction, they face different challenges that require different methodologies. The ability to produce very large family size in nonhuman species, accompanied by deliberate selection, leads to a smaller effective population, higher degrees of linkage disequilibrium among individuals, and a higher average genetic relatedness among individuals within a population. For example, members of plant and animal breeds that humans have effectively created, such as modern maize or domestic cattle, are all technically "related". In human genomic prediction, by contrast, unrelated individuals in large populations are selected to estimate the effects of common SNPs. Because of smaller effective population in livestock, the mean coefficient of relationship between any two individuals is likely high, and common SNPs will tag causal variants at greater physical distance than for humans; this is the major reason for lower SNP-based heritability estimates for humans compared to livestock. In both cases, however, sample size is key for maximizing the accuracy of genomic prediction.[23]
While modern genomic prediction scoring in humans is generally referred to as a "polygenic score" (PGS) or a "polygenic risk score" (PRS), in livestock the more common term is "genomic estimated breeding value", or GEBV (similar to the more familiar "EBV", but with genotypic data). Conceptually, a GEBV is the same as a PGS: a linear function of genetic variants that are each weighted by the apparent effect of the variant. Despite this, polygenic prediction in livestock is useful for a fundamentally different reason than for humans. In humans, a PRS is used for the prediction of individual phenotype, while in livestock a GEBV is typically used to predict the offspring’s average value of a phenotype of interest in terms of the genetic material it inherited from a parent. In this way, a GEBV can be understood as the average of the offspring of an individual or pair of individual animals. GEBVs are also typically communicated in the units of the trait of interest. For example, the expected increase in milk production of the offspring of a specific parent compared to the offspring from a reference population might be a typical way of using a GEBV in dairy cow breeding and selection.[23]
Some accuracy values are given in the sections below for comparison purposes. These are given in terms of correlations and have been converted from explained variance if given in that format in the source.
In plants
The predictive value of polygenic scoring has large practical benefits for plant and animal breeding because it increases the selection precision and allows for shorter generations, both of which speed up evolution.[24] Genomic prediction with some version of polygenic scoring has been used in experiments on maize, small grains such as barley, wheat, oats and rye, and rice biparental families. In many cases, these predictions have been so successful that researchers have advocated for its use in combating global population growth and climate change.[9]
In non-human animals
- In 2016, r ≈ 0.30 for variation in milk fat percentage in three breeds of New Zealand dairy cattle.[27]
- In 2014, r ≈ 0.18 to 0.46 for various measures of meat yield, carcass weight, and fat marbling in two breeds of beef cattle.[28]
- In 2014, r ≈ 0.45 to 0.54 for growth traits in Chinese triple-yellow broiler chickens.[29]
In humans
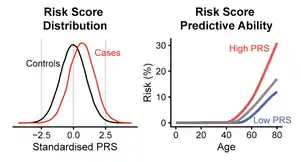
For humans, while most polygenic scores are not predictive enough to diagnose disease, they could potentially be used in addition to other covariates (such as age, BMI, smoking status) to improve estimates of disease susceptibility.[30][2][12] Although issues such as systematically poorer performance in individuals of non-European ancestry limit ethical and practical widespread use,[31] several authors have noted that many causal variants that underlie common genetic variation in Europeans are shared across different continents for (e.g.) BMI and type 2 diabetes in African populations[32] as well as schizophrenia in Chinese populations.[33] Other researchers recognize that polygenic underprediction in non-European population should galvanize new GWAS that prioritize greater genetic diversity in order to maximize the potential health benefits brought about by predictive polygenic scores.[34]
- In 2016, r ≈ 0.30 for educational attainment variation at age 16.[35] This polygenic score was based on a GWAS using data from 293,000 people.[36]
- In 2016, r ≈ 0.31 for case/control status for first-episode psychosis.[37]
- In 2017, r ≈ 0.29 for case/control status for schizophrenia in combined European and Chinese samples.[33]
- In 2018, r ≈ 0.67 for height variation in adulthood, resulting in prediction within ~3 cm for most individuals in the study.[38]
- In 2018, r ≈ 0.23 for intelligence from samples of 269,867 Europeans.[39]
- In 2018, r ≈ 0.33 to 0.36 for educational attainment and r ≈ 0.26 to 0.32 for intelligence from over 1.1 million Europeans.[40]
The use of polygenic scores for embryo selection has been criticised due to ethical and safety issues as well as limited practical utility.[41][42][43] As of 2019, polygenic scores from well over a hundred phenotypes have been developed from genome-wide association statistics.[44] These include scores that can be categorized as anthropometric, behavioural, cardiovascular, non-cancer illness, psychiatric/neurological, and response to treatment/medication.[45]
Non-predictive uses
In humans, polygenic scores were originally computed in an effort to predict the prevalence and etiology of complex, heritable diseases, which are typically affected by many genetic variants that individually confer a small effect to overall risk. A genome-wide association study (GWAS) of a such a polygenic trait is able to identify these individual genetic loci of small effect in a large enough sample, and various methods of aggregating the results can be used to form a polygenic score. This score will typically explain at least a few percent of a phenotype's variance, and can therefore be assumed to effectively incorporate a significant fraction of the genetic variants affecting that phenotype. A polygenic score can be used in several different ways: as a lower bound to test whether heritability estimates may be biased; as a measure of genetic overlap of traits (genetic correlation), which might indicate e.g. shared genetic bases for groups of mental disorders; as a means to assess group differences in a trait such as height, or to examine changes in a trait over time due to natural selection indicative of a soft selective sweep (as e.g. for intelligence where the changes in frequency would be too small to detect on each individual hit but not on the overall polygenic score); in Mendelian randomization (assuming no pleiotropy with relevant traits); to detect & control for the presence of genetic confounds in outcomes (e.g. the correlation of schizophrenia with poverty); or to investigate gene–environment interactions and correlations.
References
- Dudbridge F (March 2013). "Power and predictive accuracy of polygenic risk scores". PLOS Genetics. 9 (3): e1003348. doi:10.1371/journal.pgen.1003348. PMC 3605113. PMID 23555274.
- Torkamani A, Wineinger NE, Topol EJ (September 2018). "The personal and clinical utility of polygenic risk scores". Nature Reviews. Genetics. 19 (9): 581–590. doi:10.1038/s41576-018-0018-x. PMID 29789686. S2CID 46893131.
- Lambert SA, Abraham G, Inouye M (November 2019). "Towards clinical utility of polygenic risk scores". Human Molecular Genetics. 28 (R2): R133–R142. doi:10.1093/hmg/ddz187. PMID 31363735.
- de Vlaming R, Groenen PJ (2015). "The Current and Future Use of Ridge Regression for Prediction in Quantitative Genetics". BioMed Research International. 2015: 143712. doi:10.1155/2015/143712. PMC 4529984. PMID 26273586.
- Lewis CM, Vassos E (November 2017). "Prospects for using risk scores in polygenic medicine". Genome Medicine. 9 (1): 96. doi:10.1186/s13073-017-0489-y. PMC 5683372. PMID 29132412.
- Khera AV, Chaffin M, Aragam KG, Haas ME, Roselli C, Choi SH, et al. (September 2018). "Genome-wide polygenic scores for common diseases identify individuals with risk equivalent to monogenic mutations". Nature Genetics. 50 (9): 1219–1224. doi:10.1038/s41588-018-0183-z. PMC 6128408. PMID 30104762.
- Yanes T, Meiser B, Kaur R, Scheepers-Joynt M, McInerny S, Taylor S, et al. (March 2020). "Uptake of polygenic risk information among women at increased risk of breast cancer" (PDF). Clinical Genetics. 97 (3): 492–501. doi:10.1111/cge.13687. PMID 31833054. S2CID 209342044.
- Vilhjálmsson BJ, Yang J, Finucane HK, Gusev A, Lindström S, Ripke S, et al. (October 2015). "Modeling Linkage Disequilibrium Increases Accuracy of Polygenic Risk Scores". American Journal of Human Genetics. 97 (4): 576–92. doi:10.1016/j.ajhg.2015.09.001. PMC 4596916. PMID 26430803.
- Spindel JE, McCouch SR (December 2016). "When more is better: how data sharing would accelerate genomic selection of crop plants". The New Phytologist. 212 (4): 814–826. doi:10.1111/nph.14174. PMID 27716975.
- Regalado A (8 March 2019). "23andMe thinks polygenic risk scores are ready for the masses, but experts aren't so sure". MIT Technology Review. Retrieved 2020-08-14.
- Visscher PM, Wray NR, Zhang Q, Sklar P, McCarthy MI, Brown MA, Yang J (July 2017). "10 Years of GWAS Discovery: Biology, Function, and Translation". American Journal of Human Genetics. 101 (1): 5–22. doi:10.1016/j.ajhg.2017.06.005. PMC 5501872. PMID 28686856.
- Spiliopoulou A, Nagy R, Bermingham ML, Huffman JE, Hayward C, Vitart V, et al. (July 2015). "Genomic prediction of complex human traits: relatedness, trait architecture and predictive meta-models". Human Molecular Genetics. 24 (14): 4167–82. doi:10.1093/hmg/ddv145. PMC 4476450. PMID 25918167.
- Weedon MN, McCarthy MI, Hitman G, Walker M, Groves CJ, Zeggini E, et al. (October 2006). "Combining information from common type 2 diabetes risk polymorphisms improves disease prediction". PLOS Medicine. 3 (10): e374. doi:10.1371/journal.pmed.0030374. PMC 1584415. PMID 17020404.
- Xie C, Xu S (April 1998). "Efficiency of multistage marker-assisted selection in the improvement of multiple quantitative traits". Heredity. 80 ( Pt 4) (3): 489–98. doi:10.1046/j.1365-2540.1998.00308.x. PMID 9618913.
- Meuwissen TH, Hayes BJ, Goddard ME (April 2001). "Prediction of total genetic value using genome-wide dense marker maps". Genetics. 157 (4): 1819–29. PMC 1461589. PMID 11290733.
- Wray NR, Goddard ME, Visscher PM (October 2007). "Prediction of individual genetic risk to disease from genome-wide association studies". Genome Research. 17 (10): 1520–8. doi:10.1101/gr.6665407. PMC 1987352. PMID 17785532.
- Purcell SM, Wray NR, Stone JL, Visscher PM, O'Donovan MC, Sullivan PF, Sklar P (August 2009). "Common polygenic variation contributes to risk of schizophrenia and bipolar disorder". Nature. 460 (7256): 748–52. Bibcode:2009Natur.460..748P. doi:10.1038/nature08185. PMC 3912837. PMID 19571811.
- James G (2013). An Introduction to Statistical Learning: with Applications in R. Springer. ISBN 978-1461471370.
- Haws DC, Rish I, Teyssedre S, He D, Lozano AC, Kambadur P, et al. (2015-10-06). "Variable-Selection Emerges on Top in Empirical Comparison of Whole-Genome Complex-Trait Prediction Methods". PLOS ONE. 10 (10): e0138903. Bibcode:2015PLoSO..1038903H. doi:10.1371/journal.pone.0138903. PMC 4595020. PMID 26439851.
- Ware EB, Schmitz LL, Faul J, Gard A, Mitchell C, Smith JA, Zhao W, Weir D, Kardia SL (January 2017). "Heterogeneity in polygenic scores for common human traits". bioRxiv: 106062. doi:10.1101/106062.
- Vattikuti S, Lee JJ, Chang CC, Hsu SD, Chow CC (2014). "Applying compressed sensing to genome-wide association studies". GigaScience. 3 (1): 10. doi:10.1186/2047-217X-3-10. PMC 4078394. PMID 25002967.
- Gianola D, Rosa GJ (2015). "One hundred years of statistical developments in animal breeding". Annual Review of Animal Biosciences. 3: 19–56. doi:10.1146/annurev-animal-022114-110733. PMID 25387231.
- Wray NR, Kemper KE, Hayes BJ, Goddard ME, Visscher PM (April 2019). "Complex Trait Prediction from Genome Data: Contrasting EBV in Livestock to PRS in Humans: Genomic Prediction". Genetics. 211 (4): 1131–1141. doi:10.1534/genetics.119.301859. PMC 6456317. PMID 30967442.
- Heslot N, Jannink JL, Sorrells ME (January 2015). "Perspectives for Genomic Selection Applications and Research in Plants". Crop Science. 55 (1): 1–12. doi:10.2135/cropsci2014.03.0249. ISSN 0011-183X.
- Pace J, Yu X, Lübberstedt T (September 2015). "Genomic prediction of seedling root length in maize (Zea mays L.)". The Plant Journal. 83 (5): 903–12. doi:10.1111/tpj.12937. PMID 26189993.
- Sallam AH, Endelman JB, Jannink JL, Smith KP (2015-03-01). "Assessing Genomic Selection Prediction Accuracy in a Dynamic Barley Breeding Population". The Plant Genome. 8 (1): 0. doi:10.3835/plantgenome2014.05.0020. ISSN 1940-3372. PMID 33228279.
- Hayr MK, Druet T, Garrick DJ (2016-04-01). "027 Performance of genomic prediction using haplotypes in New Zealand dairy cattle". Journal of Animal Science. 94 (supplement2): 13. doi:10.2527/msasas2016-027. ISSN 1525-3163.
- Chen L, Vinsky M, Li C (February 2015). "Accuracy of predicting genomic breeding values for carcass merit traits in Angus and Charolais beef cattle". Animal Genetics. 46 (1): 55–9. doi:10.1111/age.12238. PMID 25393962.
- Liu T, Qu H, Luo C, Shu D, Wang J, Lund MS, Su G (October 2014). "Accuracy of genomic prediction for growth and carcass traits in Chinese triple-yellow chickens". BMC Genetics. 15 (110): 110. doi:10.1186/s12863-014-0110-y. PMC 4201679. PMID 25316160.
- Lewis CM, Vassos E (May 2020). "Polygenic risk scores: from research tools to clinical instruments". Genome Medicine. 12 (1): 44. doi:10.1186/s13073-020-00742-5. PMC 7236300. PMID 32423490.
- Duncan L, Shen H, Gelaye B, Meijsen J, Ressler K, Feldman M, et al. (July 2019). "Analysis of polygenic risk score usage and performance in diverse human populations". Nature Communications. 10 (1): 3328. Bibcode:2019NatCo..10.3328D. doi:10.1038/s41467-019-11112-0. PMC 6658471. PMID 31346163.
- Wang Y, Guo J, Ni G, Yang J, Visscher PM, Yengo L (July 2020). "Theoretical and empirical quantification of the accuracy of polygenic scores in ancestry divergent populations". Nature Communications. 11 (1): 3865. Bibcode:2020NatCo..11.3865W. doi:10.1038/s41467-020-17719-y. PMC 7395791. PMID 32737319.
- Li Z, Chen J, Yu H, He L, Xu Y, Zhang D, et al. (November 2017). "Genome-wide association analysis identifies 30 new susceptibility loci for schizophrenia" (PDF). Nature Genetics. 49 (11): 1576–1583. doi:10.1038/ng.3973. PMID 28991256. S2CID 205355668.
- Martin AR, Kanai M, Kamatani Y, Okada Y, Neale BM, Daly MJ (April 2019). "Clinical use of current polygenic risk scores may exacerbate health disparities". Nature Genetics. 51 (4): 584–591. doi:10.1038/s41588-019-0379-x. PMC 6563838. PMID 30926966.
- Selzam S, Krapohl E, von Stumm S, O'Reilly PF, Rimfeld K, Kovas Y, et al. (February 2017). "Predicting educational achievement from DNA". Molecular Psychiatry. 22 (2): 267–272. doi:10.1038/mp.2016.107. PMC 5285461. PMID 27431296.
- Okbay A, Beauchamp JP, Fontana MA, Lee JJ, Pers TH, Rietveld CA, et al. (May 2016). "Genome-wide association study identifies 74 loci associated with educational attainment". Nature. 533 (7604): 539–42. Bibcode:2016Natur.533..539O. doi:10.1038/nature17671. PMC 4883595. PMID 27225129.
- Vassos E, Di Forti M, Coleman J, Iyegbe C, Prata D, Euesden J, et al. (March 2017). "An Examination of Polygenic Score Risk Prediction in Individuals With First-Episode Psychosis". Biological Psychiatry. 81 (6): 470–477. doi:10.1016/j.biopsych.2016.06.028. PMID 27765268.
- Lello L, Avery SG, Tellier L, Vazquez AI, de Los Campos G, Hsu SD (October 2018). "Accurate Genomic Prediction of Human Height". Genetics. 210 (2): 477–497. doi:10.1534/genetics.118.301267. PMC 6216598. PMID 30150289.
- Savage JE, Jansen PR, Stringer S, Watanabe K, Bryois J, de Leeuw CA, et al. (2018). "Genome-wide association meta-analysis in 269,867 individuals identifies new genetic and functional links to intelligence". Nature Genetics. 50 (7): 912–19. doi:10.1038/s41588-018-0152-6. PMC 6411041. PMID 29942086.
- Lee JJ, Wedow R, Okbay A, Kong E, Maghzian O, Zacher M, et al. (2018). "Gene discovery and polygenic prediction from a genome-wide association study of educational attainment in 1.1 million individuals". Nature Genetics. 50 (8): 1112–1121. doi:10.1038/s41588-018-0147-3. PMC 6393768. PMID 30038396.
- Birney E. "Why using genetic risk scores on embryos is wrong". ewanbirney.com. Retrieved 2020-12-16.
- Karavani E, Zuk O, Zeevi D, Barzilai N, Stefanis NC, Hatzimanolis A, et al. (November 2019). "Screening Human Embryos for Polygenic Traits Has Limited Utility". Cell. 179 (6): 1424–1435.e8. doi:10.1016/j.cell.2019.10.033. PMC 6957074. PMID 31761530.
- Lázaro-Muñoz G, Pereira S, Carmi S, Lencz T (October 2020). "Screening embryos for polygenic conditions and traits: ethical considerations for an emerging technology". Genetics in Medicine: 1–3. doi:10.1038/s41436-020-01019-3. PMID 33106616.
- "The Polygenic Score (PGS) Catalog". Polygenic Score (PGS) Catalog. Retrieved 29 April 2020.
An open database of polygenic scores and the relevant metadata required for accurate application and evaluation
- Richardson TG, Harrison S, Hemani G, Davey Smith G (March 2019). "An atlas of polygenic risk score associations to highlight putative causal relationships across the human phenome". eLife. 8: e43657. doi:10.7554/eLife.43657. PMC 6400585. PMID 30835202.