Port Coquitlam (provincial electoral district)
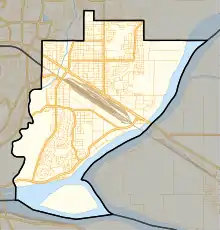
Port Coquitlam is a provincial electoral district in British Columbia, Canada, consisting of the entire city of Port Coquitlam. First established following the 1988 redistribution, it was contested in the 1991 and 1996 elections before being superseded by Port Coquitlam-Burke Mountain. The district was reestablished by the Electoral Districts Act, 2008. It was again contested in the 2009 election in which New Democrat, Mike Farnworth was elected its MLA.
 | |||
| Provincial electoral district | |||
| Legislature | Legislative Assembly of British Columbia | ||
| MLA |
New Democratic | ||
| District created | 1988 | ||
| First contested | 1991 | ||
| Last contested | 2020 | ||
| Demographics | |||
| Population (2006) | 52,692 | ||
| Area (km²) | 34.64 | ||
| Pop. density (per km²) | 1,521.1 | ||
| Census division(s) | Metro Vancouver | ||
| Census subdivision(s) | Port Coquitlam | ||
History
| Assembly | Years | Member | Party | |
|---|---|---|---|---|
| 35th | 1991–1996 | Mike Farnworth | New Democratic | |
| 36th | 1996–2001 | |||
| superseded by Port Coquitlam-Burke Mountain from 2001–2009 | ||||
| 39th | 2009–2013 | Mike Farnworth | New Democratic | |
| 40th | 2013–2017 | |||
| 41st | 2017–2020 | |||
| 42nd | 2020−present | |||
Election results
| 2020 British Columbia general election | ||||||||
|---|---|---|---|---|---|---|---|---|
| Party | Candidate | Votes | % | ±% | Expenditures | |||
| New Democratic | Mike Farnworth | 15,370 | 64.14 | +8.35 | $9,774.62 | |||
| Liberal | Mehran Zargham | 5,009 | 20.90 | −9.15 | $4,583.11 | |||
| Green | Erik Minty | 3,023 | 12.61 | −0.22 | $2,051.19 | |||
| Libertarian | Lewis Clarke Dahlby | 563 | 2.35 | +1.37 | $0.00 | |||
| Total valid votes | 23,965 | 100.00 | – | |||||
| Total rejected ballots | ||||||||
| Turnout | ||||||||
| Registered voters | ||||||||
| Source: Elections BC[1][2] | ||||||||
| 2017 British Columbia general election | ||||||||
|---|---|---|---|---|---|---|---|---|
| Party | Candidate | Votes | % | ±% | Expenditures | |||
| New Democratic | Mike Farnworth | 14,079 | 55.79 | +2.85 | $52,164 | |||
| Liberal | Susan Chambers | 7,582 | 30.05 | −6.52 | $26,734 | |||
| Green | Jason Hanley | 3,237 | 12.83 | – | $1,177 | |||
| Libertarian | Lewis Clarke Dahlby | 248 | 0.98 | −0.63 | $89 | |||
| Cascadia | Billy Gibbons | 88 | 0.35 | – | $1,973 | |||
| Total valid votes | 25,234 | 100.00 | – | |||||
| Total rejected ballots | 131 | 0.52 | −0.20 | |||||
| Turnout | 25,365 | 62.44 | +5.18 | |||||
| Registered voters | 40,621 | |||||||
| Source: Elections BC[3][4] | ||||||||
| 2013 British Columbia general election | ||||||||
|---|---|---|---|---|---|---|---|---|
| Party | Candidate | Votes | % | ±% | Expenditures | |||
| New Democratic | Mike Farnworth | 11,755 | 52.94 | −1.77 | $86,221 | |||
| Liberal | Barbara Lu | 8,120 | 36.57 | −2.28 | $23,507 | |||
| Conservative | Ryan Hague | 1,525 | 6.87 | – | $3,928 | |||
| Your Political Party | Brent Williams | 447 | 2.01 | +1.34 | $610 | |||
| Libertarian | Jogender Dahiya | 358 | 1.61 | +0.73 | $872 | |||
| Total valid votes | 22,205 | 100.00 | – | |||||
| Total rejected ballots | 160 | 0.72 | +0.20 | |||||
| Turnout | 22,365 | 57.26 | +2.05 | |||||
| Registered voters | 39,059 | |||||||
| Source: Elections BC[5] | ||||||||
| Party | Candidate | Votes | % | ± | Expenditures | |
|---|---|---|---|---|---|---|
| New Democratic | Mike Farnworth | 11,121 | 54.71% | $63,090 | ||
| Liberal | Bernie Hiller | 7,896 | 38.85% | $68,768 | ||
| Green | Cole Bertsch | 994 | 4.89% | – | $350 | |
| Libertarian | Lewis Dahlby | 178 | 0.88% | $250 | ||
| Your Political Party | Brent Williams | 137 | 0.67% | $775 | ||
| Total Valid Votes | 20,326 | 100% | ||||
| Total Rejected Ballots | 106 | 0.52% | ||||
| Turnout | 20,432 | 55.21% | ||||
References
- "2020 Provincial General Election Final Voting Results". electionsbcenr.blob.core.windows.net. Retrieved 2020-12-21.
- "Election Financing Reports". Elections BC. Retrieved 5 February 2021.
- "2017 Provincial General Election - Statement of Votes" (PDF). Elections BC. Retrieved 21 December 2020.
- "Election Financing Reports". Elections BC. Retrieved 12 September 2020.
- "Statement of Votes - 40th Provincial General Election" (PDF). Elections BC. Retrieved 17 May 2017.
This article is issued from Wikipedia. The text is licensed under Creative Commons - Attribution - Sharealike. Additional terms may apply for the media files.