Walsh diagram
Walsh diagrams, often called angular coordinate diagrams or correlation diagrams, are representations of calculated orbital binding energies of a molecule versus a distortion coordinate (bond angles), used for making quick predictions about the geometries of small molecules.[1][2] By plotting the change in molecular orbital levels of a molecule as a function of geometrical change, Walsh diagrams explain why molecules are more stable in certain spatial configurations (e.g. why water adopts a bent conformation).[3]

A major application of Walsh diagrams is to explain the regularity in structure observed for related molecules having identical numbers of valence electrons (e.g. why H2O and H2S look similar), and to account for how molecules alter their geometries as their number of electrons or spin state changes. Additionally, Walsh diagrams can be used to predict distortions of molecular geometry from knowledge of how the LUMO (Lowest Unoccupied Molecular Orbital) affects the HOMO (Highest Occupied Molecular Orbital) when the molecule experiences geometrical perturbation.
Walsh's rule for predicting shapes of molecules states that a molecule will adopt a structure that best provides the most stability for its HOMO. If a particular structural change does not perturb the HOMO, the closest occupied molecular orbital governs the preference for geometrical orientation.[4]
History
Walsh diagrams were first introduced by A.D. Walsh, a British chemistry professor at the University of Dundee, in a series of ten papers in one issue of the Journal of the Chemical Society.[5][6][7][8][9][10][11][12][13][14] Here, he aimed to rationalize the shapes adopted by polyatomic molecules in the ground state as well as in excited states, by applying theoretical contributions made by Mulliken. Specifically, Walsh calculated and explained the effect of changes in the shape of a molecule on the energy of molecular orbitals. Walsh diagrams are an illustration of such dependency, and his conclusions are what are referred to as the "rules of Walsh."[15]
In his publications, Walsh showed through multiple examples that the geometry adopted by a molecule in its ground state primarily depends on the number of its valence electrons.[16] He himself acknowledged that this general concept was not novel, but explained that the new data available to him allowed the previous generalizations to be expanded upon and honed. He also noted that Mulliken had previously attempted to construct a correlation diagram for the possible orbitals of a polyatomic molecule in two different nuclear configurations, and had even tried to use this diagram to explain shapes and spectra of molecules in their ground and excited states.[17][18] However, Mulliken was unable to explain the reasons for the rises and falls of certain curves with increases in angle, thus Walsh claimed "his diagram was either empirical or based upon unpublished computations."[5]
Overview
Walsh originally constructed his diagrams by plotting what he described as "orbital binding energies" versus bond angles. What Walsh was actually describing by this term is unclear; some believe he was in fact referring to ionization potentials, however this remains a topic of debate.[19] At any rate, the general concept he put forth was that the total energy of a molecule is equal to the sum of all of the "orbital binding energies" in that molecule. Hence, from knowledge of the stabilization or destabilization of each of the orbitals by an alteration of the molecular bond angle, the equilibrium bond angle for a particular state of the molecule can be predicted. Orbitals which interact to stabilize one configuration (ex. Linear) may or may not overlap in another configuration (ex. Bent), thus one geometry will be calculably more stable than the other.
Typically, core orbitals (1s for B, C, N, O, F, and Ne) are excluded from Walsh diagrams because they are so low in energy that they do not experience a significant change by variations in bond angle. Only valence orbitals are considered. However, one should keep in mind that some of the valence orbitals are often unoccupied.
Generating Walsh Diagrams
In preparing a Walsh diagram, the geometry of a molecule must first be optimized for example using the Hartree–Fock (HF) method [2] for approximating the ground-state wave function and ground-state energy of a quantum many-body system.[20] Next, single-point energies are performed for a series of geometries displaced from the above-determined equilibrium geometry. Single-point energies (SPEs) are calculations of potential energy surfaces of a molecule for a specific arrangement of the atoms in that molecule. In conducting these calculations, bond lengths remain constant (at equilibrium values) and only the bond angle should be altered from its equilibrium value. The single-point computation for each geometry can then be plotted versus bond angle to produce the representative Walsh diagram.
Structure of a Walsh Diagram

AH2 Molecules
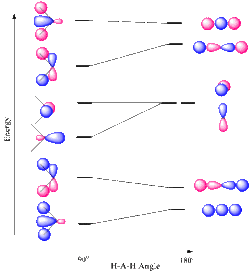
For the simplest AH2 molecular system, Walsh produced the first angular correlation diagram by plotting the ab initio orbital energy curves for the canonical molecular orbitals while changing the bond angle from 90° to 180°. As the bond angle is distorted, the energy for each of the orbitals can be followed along the lines, allowing a quick approximation of molecular energy as a function of conformation. It is still unclear whether or not the Walsh ordinate considers nuclear repulsion, and this remains a topic of debate.[21] A typical prediction result for water is a bond angle of 90°, which is not even close to the experimental derived value of 104°. At best the method is able to differentiate between a bent and linear molecule.[2]
This same concept can be applied to other species including non-hydride AB2 and BAC molecules, HAB and HAAH molecules, tetraatomic hydride molecules (AH3), tetraatomic nonhydride molecules (AB), H2AB molecules, acetaldehyde, pentaatomic molecules (CH3I), hexaatomic molecules (ethylene), and benzene.
Reactivity
Walsh diagrams in conjunction with molecular orbital theory can also be used as a tool to predict reactivity. By generating a Walsh Diagram and then determining the HOMO/LUMO of that molecule, it can be determined how the molecule is likely to react. In the following example, the Lewis acidity of AH3 molecules such as BH3 and CH3+ is predicted.
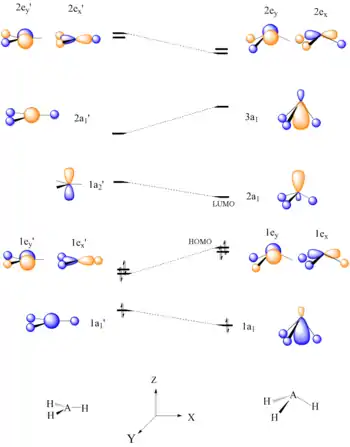
Six electron AH3 molecules should have a planar conformation. It can be seen that the HOMO, 1e’, of planar AH3 is destabilized upon bending of the A-H bonds to form a pyramid shape, due to disruption of bonding. The LUMO, which is concentrated on one atomic center, is a good electron acceptor and explains the Lewis acid character of BH3 and CH3+.[22]
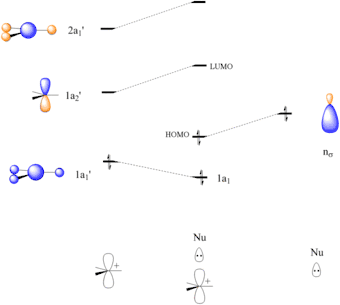
Walsh correlation diagrams can also be used to predict relative molecular orbital energy levels. The distortion of the hydrogen atoms from the planar CH3+ to the tetrahedral CH3-Nu causes a stabilization of the C-Nu bonding orbital, σ.[22]
 A Walsh diagram for a planar AH3 molecule |
 Orbital interaction diagram for nucleophilic addition to CH3+ |
Other correlation diagrams
Other correlation diagrams are Tanabe-Sugano diagrams and Orgel diagrams.
See also
|
References
- IUPAC, Compendium of Chemical Terminology, 2nd ed. (the "Gold Book") (1997). Online corrected version: (2006–) "correlation diagram". doi:10.1351/goldbook.C01348
- Miller Carrie S (2015). "Walsh Diagrams: Molecular Orbital and Structure Computational Chemistry Exercise for Physical Chemistry". Journal of Chemical Education. 92: 1040–1043. doi:10.1021/ed500813d.
- Chen, E.; Chang, T. (1998). "Walsh Diagram and the Linear Combination of Bond Orbital Method". Journal of Molecular Structure: THEOCHEM. 431 (1–2): 127–136. doi:10.1016/S0166-1280(97)00432-6.
- Mulliken, R.S. (1955). "Structures of the Halogen Molecules and the Strength of Single Bonds". J. Am. Chem. Soc. 77 (4): 884–887. doi:10.1021/ja01609a020.
- Walsh, A.D. (1953). "The Electronic Orbitals, Shapes, and Spectra of Polyatomic Molecules. Part I. AH2 Molecules". J. Chem. Soc.: 2260–2266. doi:10.1039/JR9530002260.
- Walsh, A.D. (1953). "The Electronic Orbitals, Shapes, and Spectra of Polyatomic Molecules. Part II. AB2 and BAC Molecules". J. Chem. Soc.: 2266–2288. doi:10.1039/JR9530002266.
- Walsh, A.D. (1953). "The Electronic Orbitals, Shapes, and Spectra of Polyatomic Molecules. Part III. HAB and HAAH Molecules". J. Chem. Soc.: 2288–2296. doi:10.1039/JR9530002288.
- Walsh, A.D. (1953). "The Electronic Orbitals, Shapes, and Spectra of Polyatomic Molecules. Part IV. Tetratomic hydride molecules, AH3". J. Chem. Soc.: 2296–2301. doi:10.1039/JR9530002296.
- Walsh, A.D. (1953). "The Electronic Orbitals, Shapes, and Spectra of Polyatomic Molecules. Part V. Tetratomic, non-hydride molecules, AB3". J. Chem. Soc.: 2301–2306. doi:10.1039/JR9530002301.
- Walsh, A.D. (1953). "The Electronic Orbitals, Shapes, and Spectra of Polyatomic Molecules. Part VI. H2AB Molecules". J. Chem. Soc.: 2306–2317. doi:10.1039/JR9530002306.
- Walsh, A.D. (1953). "The Electronic Orbitals, Shapes, and Spectra of Polyatomic Molecules. Part VII. A note on the near-ultra-violet spectrum of acetaldehyde". J. Chem. Soc.: 2318–2320. doi:10.1039/JR9530002318.
- Walsh, A.D. (1953). "The Electronic Orbitals, Shapes, and Spectra of Polyatomic Molecules. Part VIII. Pentatomic molecules: CH3I Molecules". J. Chem. Soc.: 2321–2324. doi:10.1039/JR9530002321.
- Walsh, A.D. (1953). "The Electronic Orbitals, Shapes, and Spectra of Polyatomic Molecules. Part IX. Hexatomic molecules: ethylene". J. Chem. Soc.: 2325–2329. doi:10.1039/JR9530002325.
- Walsh, A.D. (1953). "The Electronic Orbitals, Shapes, and Spectra of Polyatomic Molecules. Part X. A note on the spectrum of benzene". J. Chem. Soc.: 2330–2331. doi:10.1039/JR9530002330.
- Mulliken, R.S. (1955). "Bond Angles in Water-Type and Ammonia-Type Molecules and Their Derivatives". J. Am. Chem. Soc. 77 (4): 887–891. doi:10.1021/ja01609a021.
- Walsh, A.D. (1976). "Some Notes on the Electronic Spectra of Small Polyatomic Molecules". Int. Rev. Sci.: Phys. Chem., Ser. Two. 3: 301–316.
- O'Leary, B.; Mallion, R.B. (1987). "Walsh Diagrams and the Hellman-Feynman Theorem: A Tribute to the Late Professor Charles A. Coulson, F.R.S. (1910-1974)". Journal of Mathematical Chemistry. 1 (4): 335–344. doi:10.1007/BF01205066.
- Atkins, P.W. (1970). Molecular Quantum Mechanics. Oxford, Massachusetts: Clarendon Press. ISBN 978-0-19-855129-4.
- Peters, D. (1966). "Nature of the One-Electron Energies of the Independent Electron Molecular Orbital Theoryand the Walsh Diagrams". Transactions of the Faraday Society. 6: 1353–1361.
- Chen, E.; Chang, T. (1997). "Orbital Interaction and the Mulliken-Walsh Diagram for AH2 Systems". Journal of the Chinese Chemical Society (Taipei). 44: 559–565. doi:10.1002/jccs.199700086.
- Takahata, Y.; Parr, R.G. (1974). "Three Methods to Look at Walsh-type Diagrams Including Nuclear Repulsions". Bulletin of the Chemical Society of Japan. 47 (6): 1380–1386. doi:10.1246/bcsj.47.1380.
- Atkins, P.W..; et al. (1970). Inorganic Chemistry: Shriver and Atkins. Oxford, U.K.: Oxford University Press. ISBN 978-0-19-926463-6.