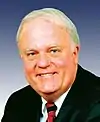
Wisconsin's 9th congressional district
Wisconsin's 9th congressional district was a congressional district of the United States House of Representatives in Wisconsin. It was created following the 1870 Census along with the 8th district, and was disbanded after the 2000 Census.
From 1965 to 2003, the district included most of the western and north-western suburbs of Milwaukee. In its final configuration, it contained all of Washington and Ozaukee counties, most of Dodge and Jefferson counties, the northern and western halves of Waukesha county and the eastern parts of Sheboygan county, including the town itself.[1] It was usually the most Republican district in the state, voting 63% to 34% for George Bush over Al Gore at the 2000 election.[2] The district was also the longest in the state (as well as the last) to be represented by a member of the Wisconsin Progressive Party however, when the party briefly surged to dominate Wisconsin’s politics during the 1930s, being represented by Merlin Hull for twelve years until 1947, when he switched to the Republican Party. At the time, the district covered much of the far western part of the state.
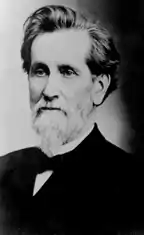
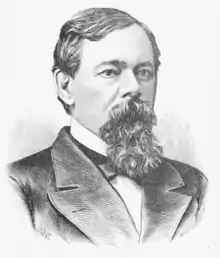
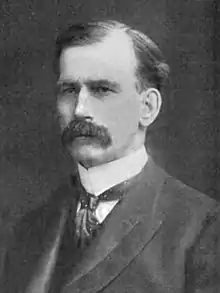
List of members representing the district
Electoral history
| Year | Democrat | Votes | Pct | Republican | Votes | Pct | 3rd Party | Party | Votes | Pct | 3rd Party | Party | Votes | Pct | |||||
|---|---|---|---|---|---|---|---|---|---|---|---|---|---|---|---|---|---|---|---|
| 1884 | James Meehan | 19,885 | 45% | Isaac Stephenson | 23,414 | 54% | A. J. Smith | Prohibition | 457 | 1% | |||||||||
| 1886 | John Ringle | 17,763 | 44% | Isaac Stephenson | 22,518 | 56% | * | ||||||||||||
| 1888 | H. W. Early | 24,775 | 45% | Myron H. McCord | 27,538 | 51% | A. C. Merryman | Prohibition | 1,467 | 3% | John F. Moore | Union Labor | 579 | 1% | * | ||||
| 1890 | Thomas Lynch | 24,491 | 54% | Myron H. McCord | 19,151 | 43% | J. H. Vrooman | Prohibition | 1,290 | 3% | * | ||||||||
| 1892 | Thomas Lynch | 19,608 | 52% | Myron H. McCord | 16,519 | 44% | Adolph D. Pergoli | People's | 1,423 | 4% | William D. Badger | Prohibition | 26 | 0% | |||||
| 1894 | Thomas Lynch | 14,910 | 37% | Alexander Stewart | 22,741 | 56% | John F. Miles | People's | 2,187 | 5% | John J. Sherman | Prohibition | 785 | 2% | |||||
| 1896 | William W. O'Keefe | 17,705 | 37% | Alexander Stewart | 30,438 | 63% | |||||||||||||
| 1898 | Wells M. Ruggles | 14,373 | 40% | Alexander Stewart | 20,825 | 58% | Edwin Kerswill | Prohibition | 663 | 2% | |||||||||
| 1900 | Ernest Schweppe | 16,983 | 33% | Webster E. Brown | 33,339 | 65% | John F. Scott | Prohibition | 1,188 | 2% | |||||||||
| 1902 | Edward Decker | 11,479 | 41% | Edward S. Minor | 15,958 | 57% | Thomas W. Lomas | Prohibition | 518 | 2% | |||||||||
| 1904 | B. J. McGrehan | 13,124 | 37% | Edward S. Minor | 19,764 | 58% | J. W. Harris | Socialist | 667 | 2% | C. W. Lomas | Prohibition | 450 | 1% | |||||
| 1906 | Philip A. Badour | 8,689 | 37% | Gustav Küstermann | 14,189 | 61% | Joseph E. Harris | Socialist | 547 | 2% | |||||||||
| 1908 | Luther Lindauer | 15,249 | 44% | Gustav Küstermann | 18,562 | 54% | Joseph E. Harris | Socialist | 788 | 2% | |||||||||
| 1910 | Thomas F. Konop | 12,140 | 46% | Gustav Küstermann | 12,135 | 46% | Thomas J. Oliver | Socialist | 1,777 | 7% | Alex McEathron | Prohibition | 555 | 2% | |||||
| 1912 | Thomas F. Konop | 16,843 | 49% | Elmer A. Morse | 16,139 | 46% | James Oliver | Socialist | 1,138 | 3% | Jason L. Sizer | Prohibition | 631 | 2% | |||||
| 1914 | Thomas F. Konop | 15,462 | 51% | John W. Reynolds, Sr. | 13,525 | 45% | Thomas J. Oliver | Socialist | 1,157 | 4% | |||||||||
| 1916 | Thomas F. Konop | 18,078 | 46% | David G. Classon | 20,614 | 53% | Frederick Nanman | Socialist | 576 | 2% | |||||||||
| 1918 | Andrew R. McDonald | 10,702 | 40% | David G. Classon | 16,352 | 60% | |||||||||||||
| 1920 | Andrew R. McDonald | 20,108 | 37% | David G. Classon | 32,027 | 59% | Harry G. Hanrahan | Socialist | 1,933 | 4% | |||||||||
| 1922 | (no candidate) | George J. Schneider | 35,117 | 62% | Henry Graass | Independent | 22,015 | 39% | |||||||||||
| 1924 | T. J. Reinert | 18,449 | 29% | George J. Schneider | 45,159 | 71% | |||||||||||||
| 1926 | (no candidate) | George J. Schneider | 41,498 | 100% | |||||||||||||||
| 1928 | James H. McGillan | 33,302 | 39% | George J. Schneider | 52,300 | 60% | Maria I. A. Nelson | Prohibition | 967 | 1% | |||||||||
| 1930 | (no candidate) | George J. Schneider | 43,080 | 100% | |||||||||||||||
| 1932 | Miles H. McNally | 39,874 | 43% | James A. Frear | 52,680 | 57% | |||||||||||||
| 1934 | Willis E. Donley | 20,828 | 24% | Knute Anderson | 20,043 | 23% | Merlin Hull | Progressive | 42,422 | 50% | Paul Boyd | Socialist | 2,279 | 3% | |||||
| 1936 | Edwin J. Larkin | 14,702 | 19% | (no candidate) | Merlin Hull | Progressive | 61,593 | 81% | |||||||||||
| 1938 | William F. Crane | 5,066 | 6% | Hugh M. Jones | 32,375 | 40% | Merlin Hull | Progressive | 42,880 | 53% | |||||||||
| 1940 | James E. Hughes | 6,763 | 6% | John R. Nygaard | 47,825 | 41% | Merlin Hull | Progressive | 61,009 | 53% | |||||||||
| 1942 | Jack E. Joyce | 3,448 | 6% | George H. Hipke | 19,972 | 33% | Merlin Hull | Progressive | 37,919 | 62% | |||||||||
| 1944 | (no candidate) | (no candidate) | Merlin Hull | Progressive | 48,064 | 99% | Adolph Maassen | Socialist | 736 | 2% | |||||||||
| 1946 | (no candidate) | Merlin Hull | 70,527 | 99% | Adolph Maassen | Socialist | 695 | 1% | |||||||||||
| 1948 | (no candidate) | Merlin Hull | 76,903 | 99% | Howard C. Hendricks | Socialist | 708 | 1% | |||||||||||
| 1950 | Arthur L. Henning | 24,871 | 29% | Merlin Hull | 60,337 | 71% | |||||||||||||
| 1952 | Kent L. Pillsbury | 43,437 | 35% | Merlin Hull | 81,258 | 65% | |||||||||||||
| 1953 | Lester Johnson | 27,852 | 57% | Arthur L. Padrutt | 21,127 | 43% | |||||||||||||
| 1954 | Lester Johnson | 52,485 | 55% | William E. Owen | 42,234 | 45% | |||||||||||||
| 1956 | Lester Johnson | 62,476 | 51% | Arthur L. Peterson | 59,024 | 49% | |||||||||||||
| 1958 | Lester Johnson | 55,420 | 63% | Charles A. Hornback | 32,425 | 37% | |||||||||||||
| 1960 | Lester Johnson | 74,268 | 57% | Perry M. Hull | 57,069 | 44% | |||||||||||||
| 1962 | Lester Johnson | 50,025 | 56% | Dennis B. Danielson | 39,955 | 44% | |||||||||||||
| 1964 | James P. Buckley | 85,071 | 45% | Glenn R. Davis | 105,332 | 55% | |||||||||||||
| 1966 | James P. Buckley | 47,674 | 36% | Glenn R. Davis | 85,297 | 64% | |||||||||||||
| 1968 | Carol E. Baumann | 73,891 | 37% | Glenn R. Davis | 126,392 | 63% | |||||||||||||
| 1970 | Fred N. Tabak | 78,123 | 48% | Glenn R. Davis | 84,723 | 52% | |||||||||||||
| 1972 | Ralph A. Fine | 76,585 | 37% | Glenn R. Davis | 128,230 | 61% | George Reed | American | 4,024 | 2% | |||||||||
| 1974 | Lynn S. Adelman | 66,071 | 45% | Robert W. Kasten, Jr. | 77,733 | 53% | William D. Quirk | American | 3,037 | 2% | |||||||||
| 1976 | Lynn M. McDonald | 84,706 | 34% | Robert W. Kasten, Jr. | 163,791 | 66% | |||||||||||||
| 1978 | Matthew J. Flynn | 75,207 | 39% | F. James Sensenbrenner, Jr. | 118,386 | 61% | |||||||||||||
| 1980 | Gary C. Benedict | 56,838 | 22% | F. James Sensenbrenner, Jr. | 206,227 | 78% | |||||||||||||
| 1982 | (no candidate) | F. James Sensenbrenner, Jr. | 111,503 | 100% | |||||||||||||||
| 1984 | John Krause | 64,157 | 26% | F. James Sensenbrenner, Jr. | 180,247 | 73% | Stephen K. Hauser | Constitution | 1,306 | 1% | |||||||||
| 1986 | Thomas G. Popp | 38,636 | 22% | F. James Sensenbrenner, Jr. | 138,766 | 78% | |||||||||||||
| 1988 | Thomas J. Hickey | 62,003 | 25% | F. James Sensenbrenner, Jr. | 185,093 | 75% | |||||||||||||
| 1990 | (no candidate) | F. James Sensenbrenner, Jr. | 117,967 | 100% | |||||||||||||||
| 1992 | Ingrid K. Buxton | 77,362 | 28% | F. James Sensenbrenner, Jr. | 192,898 | 70% | David E. Marlow | Independent | 4,619 | 2% | Jeffrey Holt Millikin | Libertarian | 1,881 | 1% | * | ||||
| 1994 | (no candidate) | F. James Sensenbrenner, Jr. | 141,617 | 100% | * | ||||||||||||||
| 1996 | Floyd Brenholt | 67,740 | 25% | F. James Sensenbrenner, Jr. | 197,910 | 74% | * | ||||||||||||
| 1998 | (no candidate) | F. James Sensenbrenner, Jr. | 175,533 | 91% | Jeffrey M. Gonyo | Independent | 16,419 | 9% | * | ||||||||||
| 2000 | Mike Clawson | 83,720 | 26% | F. James Sensenbrenner, Jr. | 239,498 | 74% | * |
References
- Alamanac of American politics 2002 edition, Michael Barone, pages 1646,1676-8
- Barone
- "Wisconsin U.S. House elections, 1848-2008" (PDF). Hubert H. Humphrey School of Public Affairs - University of Minnesota. Retrieved 2011-11-09.
- Martis, Kenneth C. (1989). The Historical Atlas of Political Parties in the United States Congress. New York: Macmillan Publishing Company.
- Martis, Kenneth C. (1982). The Historical Atlas of United States Congressional Districts. New York: Macmillan Publishing Company.
- Congressional Biographical Directory of the United States 1774–present
.jpg.webp)
.jpg.webp)
.jpg.webp)
