1962 South Australian state election
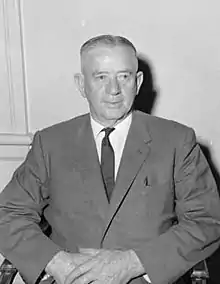
State elections were held in South Australia on 3 March 1962. All 39 seats in the South Australian House of Assembly were up for election. The incumbent Liberal and Country League led by Premier of South Australia Thomas Playford IV defeated the Australian Labor Party led by Leader of the Opposition Frank Walsh.[1][2]
| |||||||||||||||||||||||||||||||
All 39 seats in the South Australian House of Assembly 20 seats were needed for a majority | |||||||||||||||||||||||||||||||
|---|---|---|---|---|---|---|---|---|---|---|---|---|---|---|---|---|---|---|---|---|---|---|---|---|---|---|---|---|---|---|---|
| |||||||||||||||||||||||||||||||
| |||||||||||||||||||||||||||||||
Background
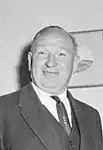
The Playford government, in power since 1938, went into the 1962 elections in a precarious position. At the time the writs were issued, South Australia was dogged by a massive recession. This led observers to think that Labor would finally have a chance at power. Longtime opposition leader Mick O'Halloran had died suddenly in 1960, and Labor was led into the election by former deputy leader Frank Walsh.[1][2]
The Labor opposition won in excess of 54 percent of the statewide two-party vote, however the LCL retained government with the assistance of the Playmander − an electoral malapportionment in which there were two country seats for every one seat in Adelaide. This system resulted in Labor being denied government in 1944, 1953 and 1968 despite winning clear statewide two-party majorities.[1][2]
While O'Halloran had despaired of ever becoming Premier, Walsh made a concerted effort to end the LCL's three-decade grip on government. Knowing that the Playmander made a statewide campaign fruitless, Walsh instead decided to target marginal LCL seats. In the election, Labor scored 54.3 percent of the two-party vote to only 45.7 percent for the LCL, a 4.6 percent swing to Labor. In most other states, this would have made Walsh premier with a landslide majority. However, due to the Playmander, the election resulted in a hung parliament. Labor won 19 seats, one seat short of a majority, while the LCL won 18 seats, two seats short of a majority. Even with this to consider, speculation was rampant on election night that Playford's long tenure was finally over.[1][2]
Labor took the seats of Chaffey and Unley off the LCL (and later Glenelg and Barossa at the 1965 election). The LCL won only four metropolitan seats – Burnside, Glenelg, Mitcham and Torrens.[1][2]
However, Playford refused to concede, instead saying he would wait to see how the chamber lined up once the legislature reassembled. Both crossbench independent MPs, Tom Stott and Percy Quirke, held the balance of power. They announced confidence and supply support for an LCL minority government with a bare one-seat parliamentary majority. Stott became Speaker of the South Australian House of Assembly following the election, while Quirke joined the LCL and entered the ministry in 1963. Walsh lobbied Governor Edric Bastyan not to reappoint Playford, to no avail.[1][2]
The furore over the 1962 election illustrated how distorted the Playmander had become. By this time some two-thirds of the state's population resided in and around Adelaide, but they only elected one-third of the members of the legislature. In many cases, a rural vote was worth at least double a vote in Adelaide. In one of the more extreme cases, the rural seat of Frome had 4,500 formal votes in 1968, while at the same election the metropolitan seat of Enfield had 42,000 formal votes.[1][2]
Results
|
South Australian state election, 3 March 1962[3] | ||||||
|---|---|---|---|---|---|---|
| Enrolled voters | 531,228 | |||||
| Votes cast | 417,461 | Turnout | 93.98% | +0.03% | ||
| Informal votes | 10,267 | Informal | 2.46% | -0.43% | ||
| Summary of votes by party | ||||||
| Party | Primary votes | % | Swing | Seats | Change | |
| Labor | 219,790 | 53.98% | +4.63% | 19 | + 2 | |
| Liberal and Country | 140,507 | 34.51% | –2.44% | 18 | – 2 | |
| Democratic Labor | 31,543 | 7.75% | +2.09% | 0 | ± 0 | |
| Communist | 2,528 | 0.62% | –0.80% | 0 | ± 0 | |
| Independent | 12,827 | 3.15% | –2.78% | 2 | ± 0 | |
| Total | 407,195 | 39 | ||||
| Two-party-preferred | ||||||
| Liberal and Country | 45.70% | –4.60% | ||||
| Labor | 54.30% | +4.60% | ||||
- The primary vote figures were from contested seats, while the state-wide two-party-preferred vote figures were estimated from all seats.
Post-election pendulum
| GOVERNMENT SEATS (20) | |||
| Marginal | |||
| Glenelg | Baden Pattinson | LCL | 3.3% |
| Flinders | Glen Pearson | LCL | 3.5% |
| Victoria | Leslie Harding | LCL | 3.7% |
| Torrens | John Coumbe | LCL | 3.9% |
| Fairly Safe | |||
| Onkaparinga | Howard Shannon | LCL | 6.4% |
| Burra | Percy Quirke | IND | 6.5% v LCL |
| Ridley | Tom Stott | IND | 7.3% v LCL |
| Safe | |||
| Light | John Freebairn | LCL | 10.9% |
| Alexandra | David Brookman | LCL | 13.5% |
| Burnside | Joyce Steele | LCL | 14.2% |
| Stirling | William Jenkins | LCL | 16.2% v IND |
| Mitcham | Robin Millhouse | LCL | 18.8% |
| Gumeracha | Thomas Playford | LCL | 31.1% v DLP |
| Barossa | Condor Laucke | LCL | 35.9% v COM |
| Albert | Bill Nankivell | LCL | unopposed |
| Angas | Berthold Teusner | LCL | unopposed |
| Eyre | George Bockelberg | LCL | unopposed |
| Gouger | Steele Hall | LCL | unopposed |
| Rocky River | James Heaslip | LCL | unopposed |
| Yorke Peninsula | Cecil Hincks | LCL | unopposed |
| OPPOSITION SEATS (19) | |||
| Marginal | |||
| Chaffey | Reg Curren | ALP | 0.1% |
| Millicent | Des Corcoran | ALP | 3.3% |
| Unley | Gil Langley | ALP | 3.6% |
| Fairly safe | |||
| Frome | Tom Casey | ALP | 6.2% |
| West Torrens | Fred Walsh | ALP | 8.1% |
| Norwood | Don Dunstan | ALP | 8.8% |
| Safe | |||
| Wallaroo | Lloyd Hughes | ALP | 12.9% |
| Gawler | John Clark | ALP | 16.9% |
| Mount Gambier | Ron Ralston | ALP | 18.7% |
| Murray | Gabe Bywaters | ALP | 20.6% |
| Edwardstown | Frank Walsh | ALP | 21.6% v DLP |
| Enfield | Joe Jennings | ALP | 27.7% v DLP |
| Adelaide | Sam Lawn | ALP | 30.3% v DLP |
| Port Adelaide | John Ryan | ALP | 36.0% v DLP |
| Whyalla | Ron Loveday | ALP | 37.3% v IND |
| Stuart | Lindsay Riches | ALP | 38.0% v IND |
| Port Pirie | Dave McKee | ALP | 40.8% v IND |
| Hindmarsh | Cyril Hutchens | ALP | unopposed |
| Semaphore | Harold Tapping | ALP | unopposed |
See also
- Results of the South Australian state election, 1962 (House of Assembly)
- Members of the South Australian House of Assembly, 1962-1965
- Members of the South Australian Legislative Council, 1962-1965
- Playmander
Notes
- Jaensch, Dean (March 2007). "The 1962 General Election - Formed the 37th Parliament". History of South Australian elections 1857-2006: House of Assembly, Volume 1. State Electoral Office South Australia. pp. 281–284. ISBN 9780975048634. Archived from the original on 2014-03-02. Retrieved 2015-07-27 – via Electoral Commission of South Australia.
- Tilby Stock, Jenny (1996). "The 'Playmander', Its origins, operation and effect on South Australia". In O'Neil, Bernard; Raftery, Judith; Round, Kerrie (eds.). Playford's South Australia: essays on the history of South Australia, 1933-1968. Association of Professional Historians. pp. 73–90. ISBN 9780646290928 – via Professional Historians Association (South Australia).
- "Details of SA 1962 Election". Australian Politics and Elections Database.
External links
| General elections | |
|---|---|
| Referendums | |
| Legislative Council elections |
|