1981 Atlantic hurricane season
The 1981 Atlantic hurricane season was a fairly active season that featured 22 tropical depressions and 12 storms. The season officially began on June 1, 1981, and lasted until November 30, 1981. These dates conventionally delimit the period of each year when most tropical cyclones form in the Atlantic basin. Almost all of the named storms made landfall. Cindy, Harvey, and Irene did not affect land, either directly or indirectly.
| 1981 Atlantic hurricane season | |
|---|---|
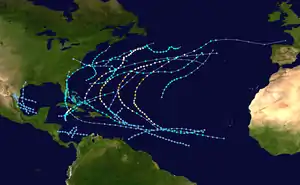 Season summary map | |
| Seasonal boundaries | |
| First system formed | April 6, 1981 |
| Last system dissipated | November 17, 1981 |
| Strongest storm | |
| Name | Harvey |
| • Maximum winds | 130 mph (215 km/h) (1-minute sustained) |
| • Lowest pressure | 946 mbar (hPa; 27.94 inHg) |
| Seasonal statistics | |
| Total depressions | 22 |
| Total storms | 12 |
| Hurricanes | 7 |
| Major hurricanes (Cat. 3+) | 3 |
| Total fatalities | 11 total |
| Total damage | $45 million (1981 USD) |
| Related articles | |
Hurricane Dennis caused millions of dollars in damage in Dade County, Florida and produced the highest rainfall totals of any tropical cyclone this season. Tropical Depression Eight caused the most damage, due to flooding in Texas at the end of August, and led to most fatalities of any tropical cyclone this season (five). Tropical Depressions Two and Eight caused a majority of the damage and fatalities this season, with both affecting Louisiana and Texas. Katrina and Bret were the only named storms with associated fatalities.[1]
Seasonal summary


The 1981 season was high in activity with eighteen tropical depressions and twelve storms forming that year. The season began early, as Tropical Storm Arlene formed on May 6. Arlene made landfall in Cuba, being absorbed later by a low.[2] Tropical Depression Two moved out of the Gulf of Mexico into eastern Texas on June 5, producing localized rainfall amounts of 12 inches (300 mm) and numerous tornadoes over Louisiana before recurving across the Southeast United States.[3] Tropical Storm Bret formed as a subtropical low in the open Atlantic Ocean, and made landfall in the Delmarva Peninsula.[4]
Tropical Depression Four formed in the Gulf of Mexico on July 25, moving into Mexico the next day, and causing heavy rains in west Texas, Oklahoma, and Arkansas when its remnants moved into the United States.[5] Tropical Storm Cindy formed on August 2 in the open Atlantic and became an extratropical cyclone on August 5.[6] Hurricane Dennis formed on August 7 near South America. Dennis degenerated into a depression while making landfall in the Leeward Islands, but regained storm strength while over Cuba. Dennis moved near the southeast United States coastline from Florida to Virginia, briefly becoming a hurricane. Dennis weakened into a tropical storm and was declared an extratropical cyclone on August 22.[7]

Tropical Depression Seven formed in mid-August and tracked through the Windward Islands before dissipating in the eastern Caribbean Sea.[8][9] Tropical Depression Eight led to a significant flooding event between San Antonio and Houston on August 30 and August 31 while recurving through Texas into Louisiana.[10] Hurricane Emily formed on September 1 southeast of Bermuda. Emily made a cyclonic loop as a tropical storm. Emily strengthened into a hurricane out in the North Atlantic Ocean and by September 12, was no longer identifiable.[11] Hurricane Floyd was a Category 3 hurricane that grazed Bermuda, but no damage was reported.[12] Hurricane Gert formed September 8, strengthened into a Category 2 hurricane, and followed the same track as Floyd, dissipating near the Azores.[13][14][15] Hurricane Harvey became the strongest storm of the season, reaching Category 4 strength. Harvey never affected land, but ships reported tropical storm-force winds.[16] Tropical Depression Thirteen brought gusts of tropical storm force to Bermuda in mid-to-late September.[17] Hurricane Irene also stayed out at sea, reaching Category 3 strength and was extratropical in early October. The extratropical Irene made landfall in France.[18]
Tropical Depression Fifteen was small and well-organized as it crossed the tropical Atlantic before weakening as it moved through the northeast Caribbean and southwest North Atlantic during late September and early October.[19][20] Tropical Storm Jose was a short-lived storm forming out in the open Atlantic in late October. Jose never affected land and dissipated on November 1 near the Azores.[21] Hurricane Katrina formed in the Caribbean Sea, and made landfall in Cuba after reaching hurricane strength. Katrina was the only named storm with fatalities.[1] The final storm of the season, Subtropical Storm Three, formed in the Atlantic Ocean on November 12 and moved north, making landfall in Nova Scotia and becoming extratropical soon after.[22]
The season's activity was reflected with a cumulative accumulated cyclone energy (ACE) rating of 100,[23] which is classified as "near normal".[24] ACE is, broadly speaking, a measure of the power of the hurricane multiplied by the length of time it existed, so storms that last a long time, as well as particularly strong hurricanes, have high ACEs. ACE is only calculated for full advisories on tropical systems at or exceeding 34 knots (39 mph, 63 km/h) or tropical storm strength. Although officially, subtropical cyclones are excluded from the total,[25] the figure above includes periods when storms were in a subtropical phase.
Systems
Tropical Storm Arlene
| Tropical storm (SSHWS) | |
  | |
| Duration | May 6 – May 9 |
|---|---|
| Peak intensity | 60 mph (95 km/h) (1-min) 999 mbar (hPa) |
A tropical disturbance that originated in the Pacific Ocean crossed Central America and entered the Caribbean Sea in early May. The disturbance developed into a tropical depression over the northwestern Caribbean on May 6, well before the official start of the hurricane season. By the following day, the depression intensified into Tropical Storm Arlene. Around 00:00 UTC on May 8, Arlene reached its minimum barometric pressure of 999 mbar (29.5 inHg). Shortly thereafter, the cyclone made landfall on the south coast of Camagüey Province in Cuba with winds of 50 mph (85 km/h). Arlene weakened to a tropical depression while moving over Cuba. After emerging into the Atlantic Ocean over the Bahamas, the system re-intensified into a tropical storm late on May 8 and reached maximum sustained winds of 60 mph (95 km/h). However, convection soon diminished and Arlene weakened back to a tropical depression early on May 9, shortly before being absorbed by a trough. The storm caused only minimal impacts.[2]
Tropical Depression Two
| Tropical depression (SSHWS) | |
  | |
| Duration | June 3 – June 5 |
|---|---|
| Peak intensity | 35 mph (55 km/h) (1-min) 996 mbar (hPa) |
A tropical depression formed in the Bay of Campeche on June 3. Classified as Tropical Depression Two, the system moved north-northwest, lured by a closed upper-cyclone over the southern Great Plains.[3] Shortly before 12:00 UTC on June 5, the depression made landfall near Matagorda, Texas, with winds of 35 mph (55 km/h).[26] Surface observations indicate that the depression's barometric pressure at landfall ranged from 991 to 996 mbar (29.3 to 29.4 inHg).[3] Although the depression dissipated later on June 5,[26] its remnants quickly recurved through the Mississippi Valley, and deepened as it moved off the coast of the Mid-Atlantic states into the Atlantic on June 7.[3]
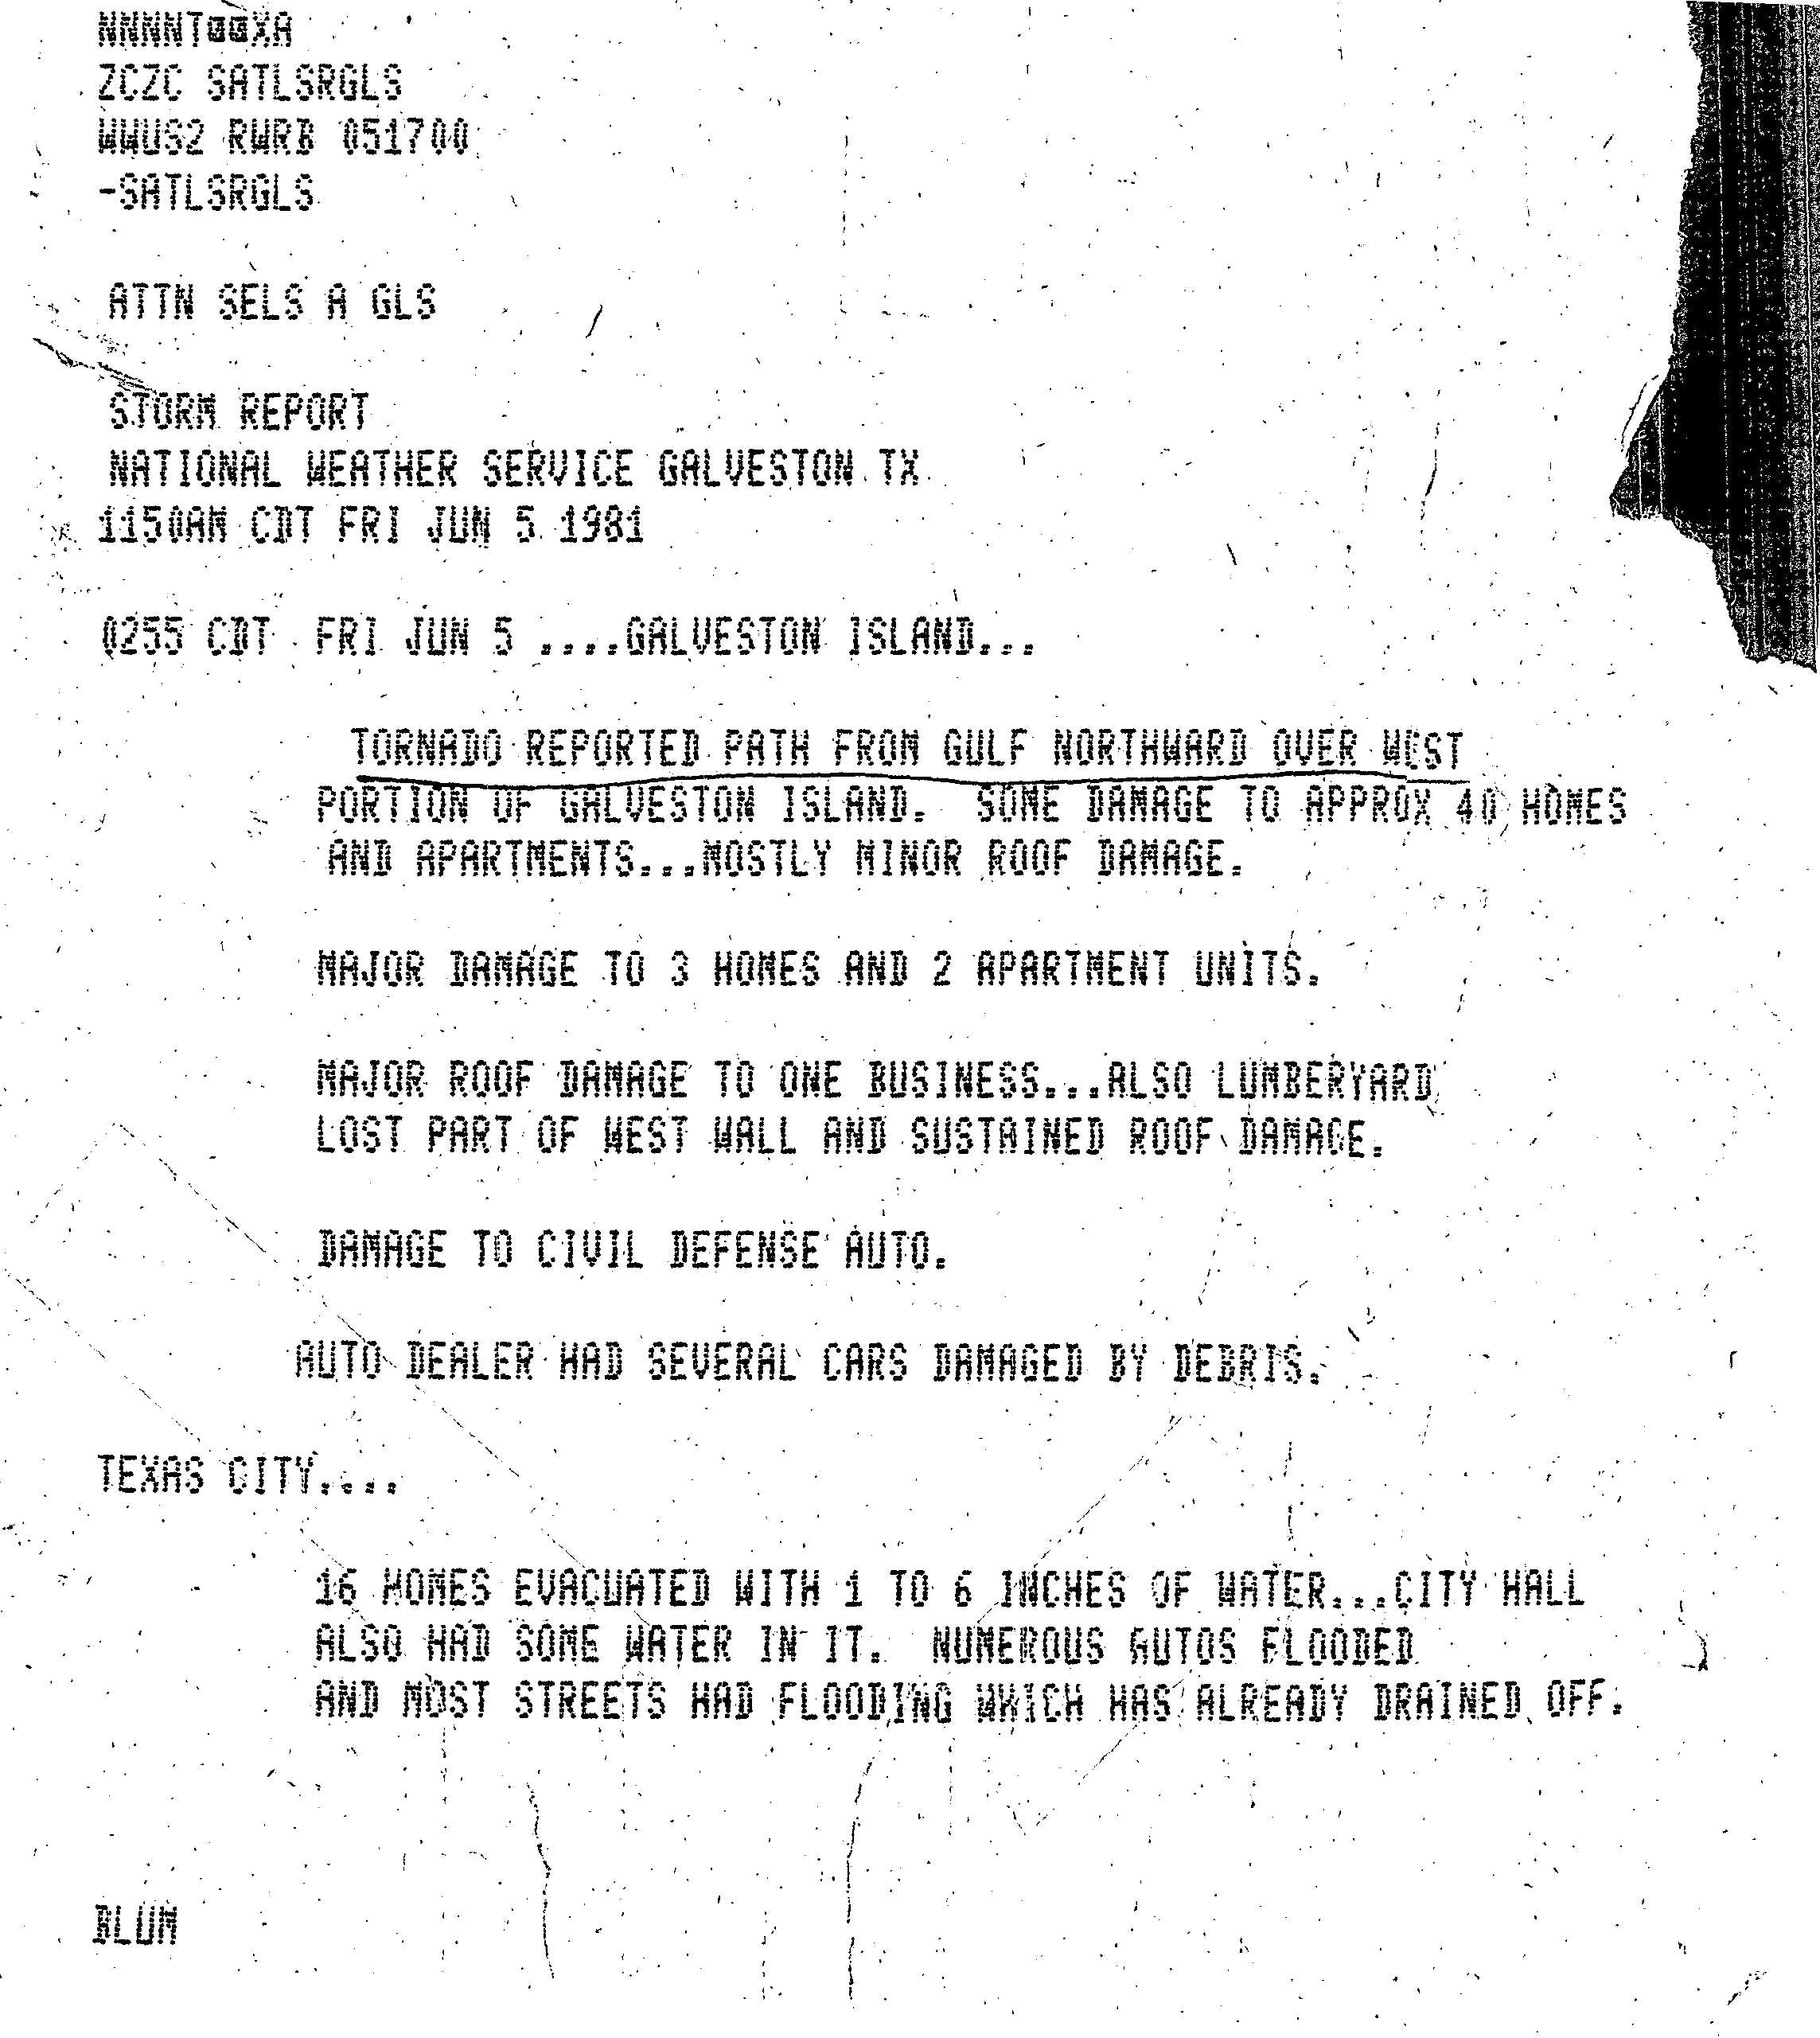
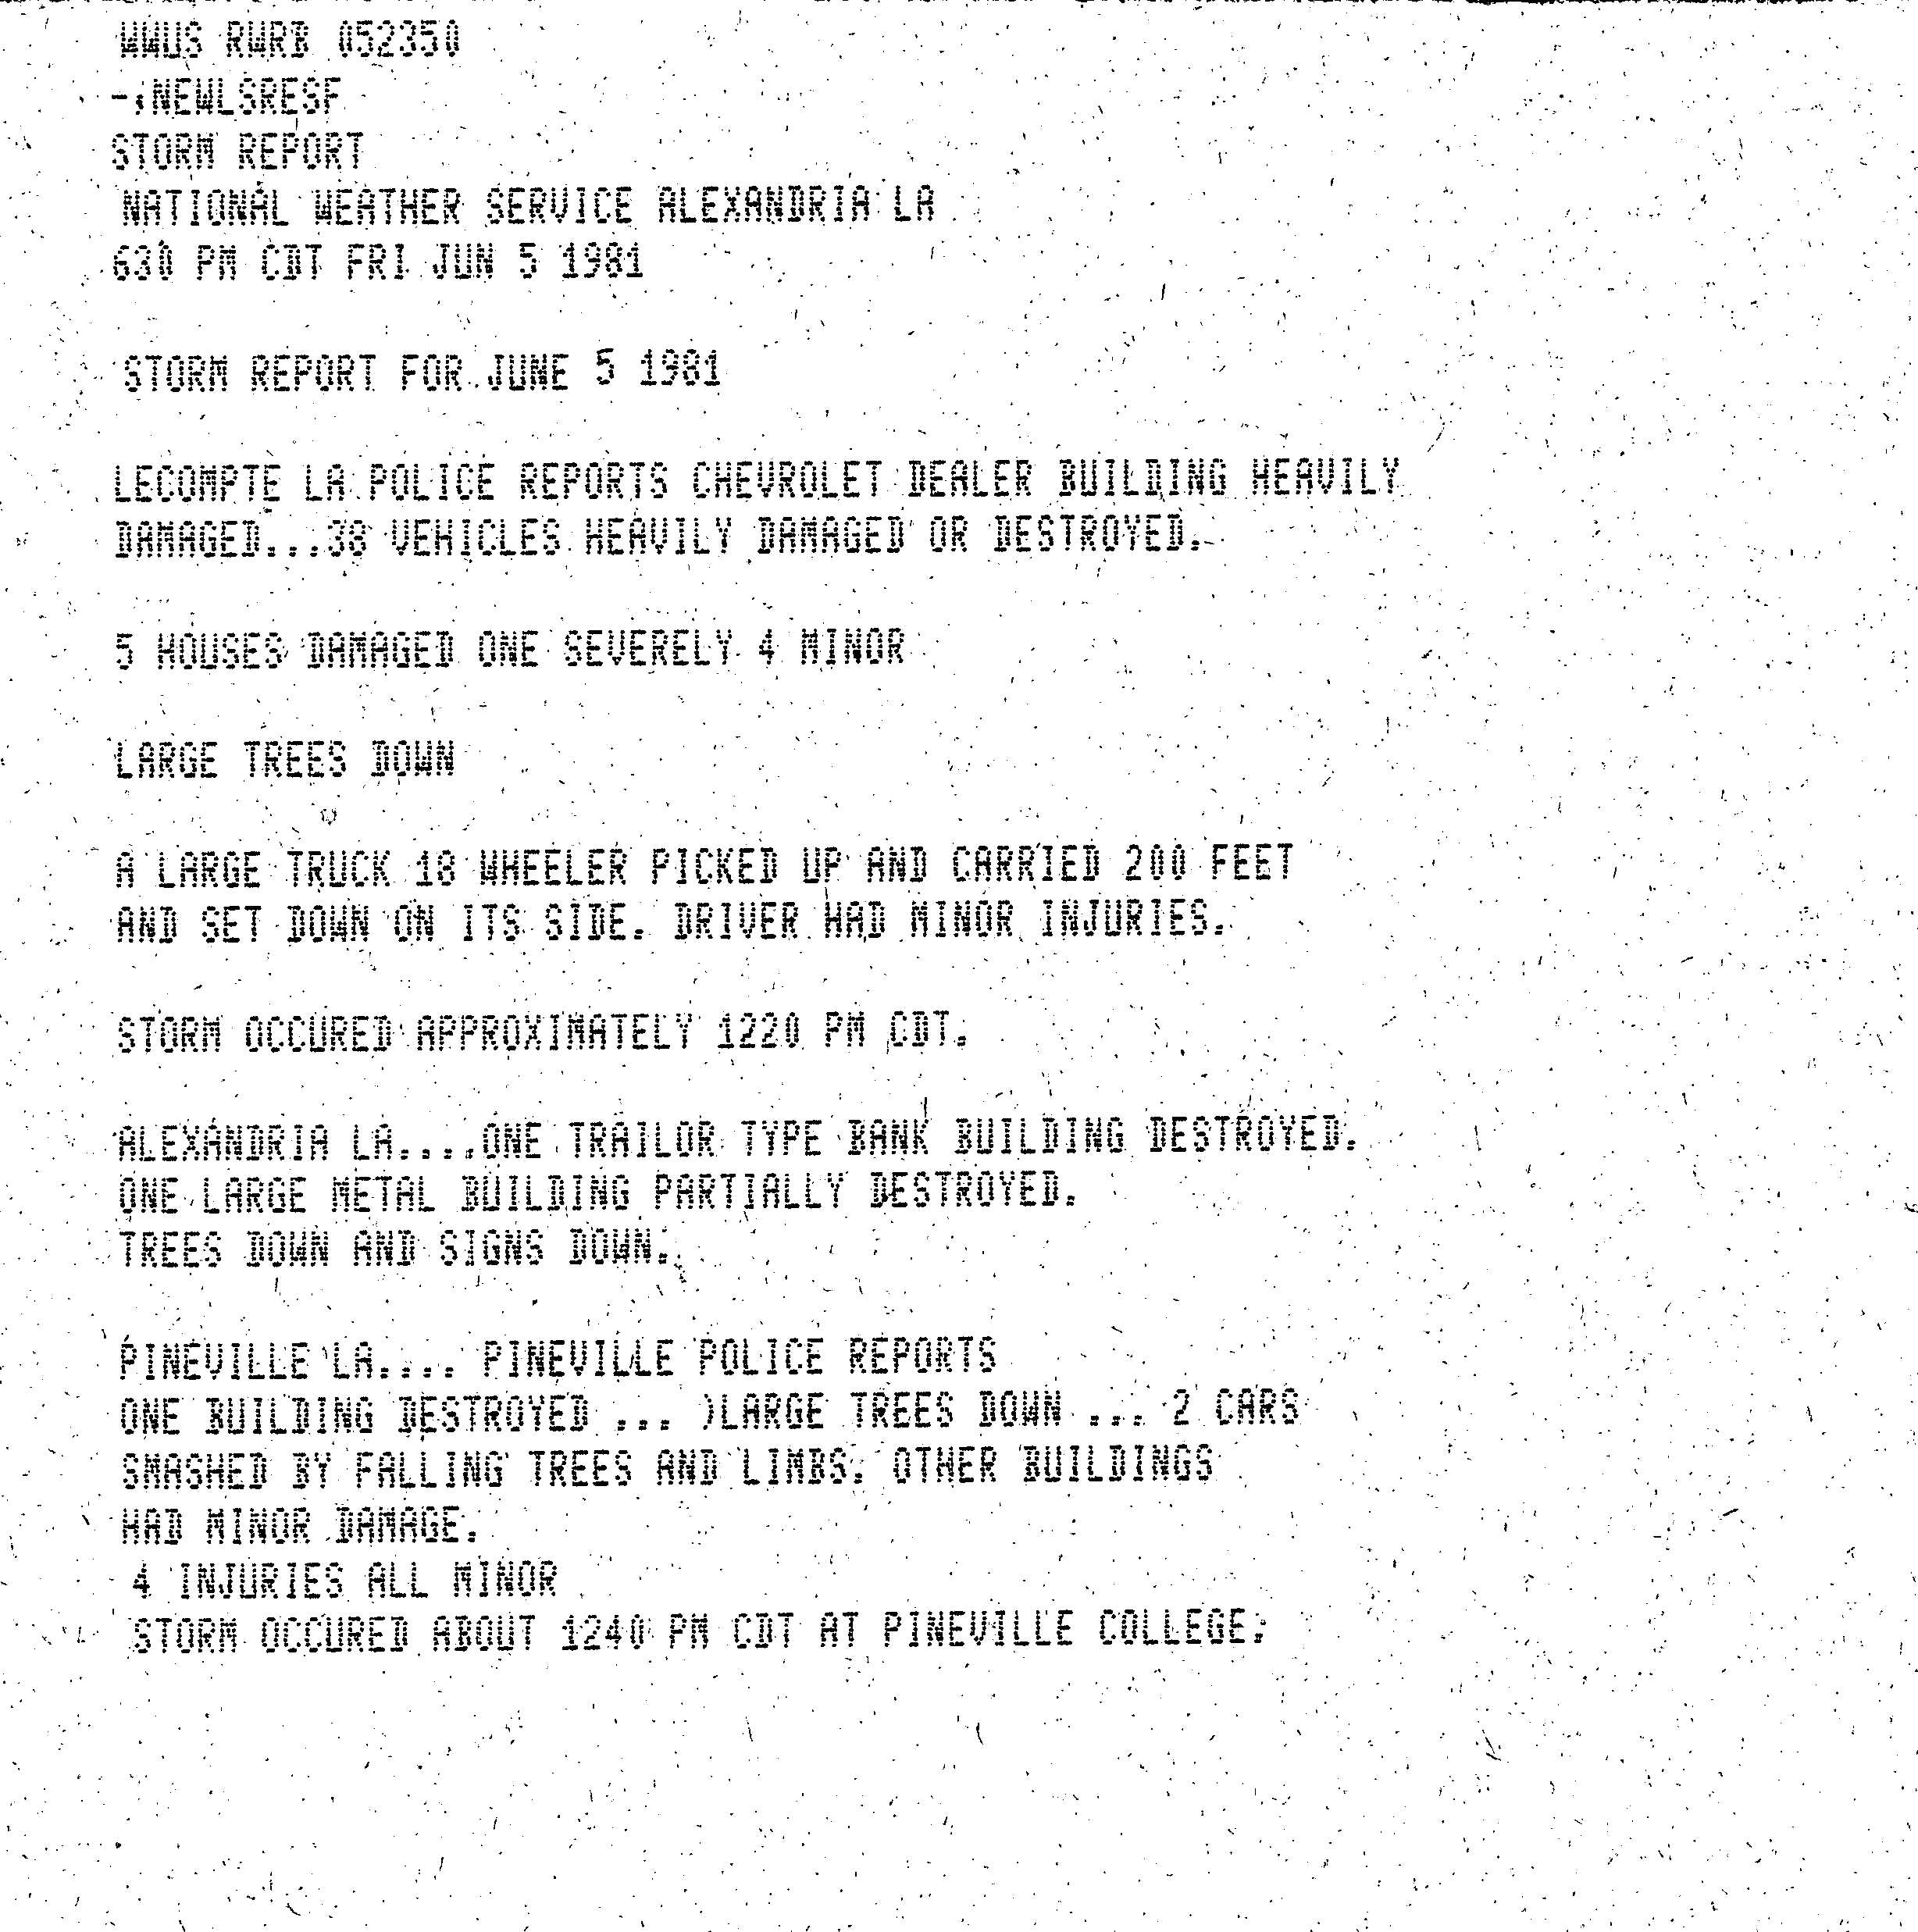
The depression, in conjunction with an upper-level low, dropped heavy rainfall in the Greater Houston area, with a peak total of 15 in (380 mm) at Lake Anahuac.[3] In Texas City, 1 to 6 in (25 to 152 mm) of water inside 16 homes forced the evacuation of their occupants,[27] with at least 23 homes suffering water damage. Water also entered city hall. Some roads had roughly 18 in (460 mm) of standing water, stranding some motorists for hours.[28] In Galveston, a tornado damaged 40 homes and apartments, with severe damage to 3 homes and 2 apartment units. One business suffered major roof damage, while several cars were damaged at an auto dealership.[27] The depression also spawned eight tornadoes in Louisiana.[3] The most destructive tornado touched down in Rapides Parish, where it substantially damaged or destroyed 38 cars at a dealership in Lecompte, severely damaged 5 homes and caused minor damage to 4 others, downed large trees, and tossed an 18-wheeler truck approximately 200 ft (61 m).[29] Overall, the depression killed three people, two due to flooding and one from an associated tornado.[30] At least $4 million in damage was caused by this depression.[3]
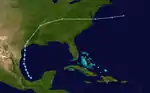
Tropical Storm Bret
| Tropical storm (SSHWS) | |
  | |
| Duration | June 29 – July 1 |
|---|---|
| Peak intensity | 70 mph (110 km/h) (1-min) 996 mbar (hPa) |
Bret formed out of a subtropical low roughly 150 miles (240 km) off the coast of North Carolina. The storm moved west-northwest, striking land in southern Maryland on July 1. Bret weakened significantly just before landfall and reported winds were below gale force. Rainfall amounts were light, with a narrow area of over one inch of rain reported near its track and within the central Appalachians. The highest rainfall amount reported was 4.48 inches (114 mm) at Big Meadows, Virginia.[31] No significant damage was reported, but one fatality was reported at Nags Head, North Carolina due to riptides.[4]
Tropical Depression Four
| Tropical depression (SSHWS) | |
 | |
| Duration | July 25 – July 26 |
|---|---|
| Peak intensity | 35 mph (55 km/h) (1-min) 1008 mbar (hPa) |
A tropical disturbance moved across the Caribbean sea between July 20 and July 24 before moving across the Yucatán peninsula.[32] After emerging into the south-central Gulf of Mexico, the disturbance organized into a tropical depression early on July 25. The depression moved west-northwest into northeast Mexico on July 26 before its surface circulation dissipated. Heavy rains fell across western Texas, Oklahoma, and Arkansas when the remains of this system interacted with a stationary front across the southern Plains between July 28 and July 30.[5]
Tropical Storm Cindy
| Tropical storm (SSHWS) | |
  | |
| Duration | August 2 – August 5 |
|---|---|
| Peak intensity | 60 mph (95 km/h) (1-min) 1002 mbar (hPa) |
A subtropical depression that developed along a cold front organized into Tropical Storm Cindy on August 2, in the open Atlantic midway between Bermuda and Nova Scotia. Cindy tracked east-northeast until it became extratropical on August 5 as it moved over colder water. The storm never affected land and caused no known damage.[6]
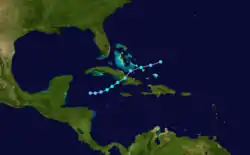
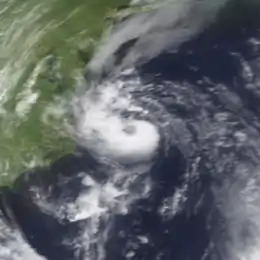
Hurricane Dennis
| Category 1 hurricane (SSHWS) | |
  | |
| Duration | August 7 – August 21 |
|---|---|
| Peak intensity | 80 mph (130 km/h) (1-min) 995 mbar (hPa) |
Dennis began as Cape Verde-type hurricanes typically do. A tropical wave leaving the coast of Africa on August 5 developed into Tropical Storm Dennis on August 7 near Cape Verde. Unlike most such storms, Dennis degenerated to a tropical wave before reaching the Windward Islands on August 12.[33] This wave crossed the Caribbean, passing over Jamaica before reaching the southwestern coast of Cuba on August 15.[34]
Once near Cuba, the wave began rapid organization, restrengthening into a tropical storm. It crossed Cuba, then moved over the Florida Keys on August 16 and mainland Florida the next day. Over Florida, steering currents weakened and the storm stalled. On August 19, Tropical Storm Dennis reemerged over water, skimming the coasts of the Carolinas before accelerating out to sea. Dennis reached hurricane strength before becoming extratropical on August 22.[34]
Most damage associated with Dennis was from the heavy rainfall caused by its slow passage over Florida, although two tornadoes were also reported within Florida.[34] The highest amount registered was near Homestead, Florida, where 25.56 inches (649 mm) of rain was measured.[7] Agriculture damage in Dade County, Florida was estimated at $15 million (1981 USD). Coastal areas of the Carolinas were also affected by heavy rainfall, with spots seeing over 10 inches (250 mm), as well as minor beach erosion.
Tropical Depression Seven
| Tropical depression (SSHWS) | |
 | |
| Duration | August 18 – August 21 |
|---|---|
| Peak intensity | 35 mph (55 km/h) (1-min) 1007 mbar (hPa) |
This system developed across the tropical Atlantic Ocean on August 18,[8] moving westward through the Windward islands into the eastern Caribbean Sea before dissipating on August 21.[9]
Tropical Depression Eight
| Tropical depression (SSHWS) | |
 | |
| Duration | August 26 – August 30 |
|---|---|
| Peak intensity | 35 mph (55 km/h) (1-min) 1004 mbar (hPa) |
This tropical depression formed in the Bay of Campeche on August 26 and moved slowly northwest, moving ashore northeast Mexico on August 29 and into the United States on August 30. As an ill-defined surface low, a large thunderstorm complex formed near its center that day, unleashing heavy rainfall in a band 50 miles (80 km) wide which stretched along a path 200 miles (320 km) long from Seguin, Texas to north of Houston, Texas. The highest rainfall amount reported was from Pine Springs in Fayette County, Texas, where 21 inches (530 mm) fell in the 24‑hour period ending on the morning of August 31. Five died in the town of Shiner, Texas due to the flood.[35] Downtown Halletsville flooded to a depth of 5 feet (1.5 m). Significant flooding occurred along the Lavaca, Guadalupe, and Colorado rivers in Texas. The cyclone spawned 14 tornadoes as well, including one at Scholes Field in Galveston, Texas which produced winds as high as 92 miles per hour (148 km/h) at 7:15 pm on August 31.[36]
Its surface circulation remained ill-defined as it produced another round of heavy rainfall across northwest Louisiana on September 1. A large mesoscale convective system moved in from Oklahoma and northeast Texas, dissipating what was left of this tropical depression by September 2. Paid losses by the Federal Emergency Management Agency (FEMA) totaled nearly US$21 million (1981 dollars), with total damages exceeding US$26 million (1981 dollars).[10][37]
Hurricane Emily
| Category 1 hurricane (SSHWS) | |
  | |
| Duration | September 1 – September 12 |
|---|---|
| Peak intensity | 90 mph (150 km/h) (1-min) 966 mbar (hPa) |
On September 1, a subtropical storm became Tropical Storm Emily southwest of Bermuda. Emily moved northeast, crossing the island the next day, but measured winds were below tropical storm force. The storm continued generally northeast and strengthened into a hurricane. Hurricane Emily weakened over the north Atlantic and was no longer identifiable as a weather system by September 12. Hurricane Emily caused beach erosion across the East Coast of the United States, but no other damage was reported.[11]
Hurricane Floyd
| Category 3 hurricane (SSHWS) | |
  | |
| Duration | September 3 – September 12 |
|---|---|
| Peak intensity | 115 mph (185 km/h) (1-min) 975 mbar (hPa) |
Floyd was first tracked as a tropical depression on September 3 when it organized east of the Leeward Islands. As the depression moved northwest, it caused heavy rain. The highest rainfall reported was 5.7 inches (140 mm) at Antigua. It strengthened into a tropical storm, then reached hurricane strength on September 7.[12]
Floyd turned to the northeast and passed just southeast of Bermuda as a weakening hurricane. As a tropical storm, Floyd moved east across the Atlantic until losing its identity on September 12.[12]
No damages are associated with Floyd. Although Bermuda was directly affected, the island experienced the weaker half of the storm.[12]
Hurricane Gert
| Category 2 hurricane (SSHWS) | |
  | |
| Duration | September 7 – September 15 |
|---|---|
| Peak intensity | 105 mph (165 km/h) (1-min) 988 mbar (hPa) |
A tropical wave exited western Africa on September 1, gradually developing a concentrated area of convection. Early on September 7, it was estimated that Tropical Depression Eleven about 400 mi (640 km) east of the Leeward Islands, based on satellite imagery. The next day, data from the Hurricane Hunters indicated the depression intensified into Tropical Storm Gert. The newly upgraded storm passed between the islands of Dominica and Guadeloupe and continued to intensify, making landfall on southeastern Puerto Rico with winds of 60 mph (95 km/h) late September 8. After emerging into the Atlantic, Gert weakened while passing off the north coast of the Dominican Republic.[38] It restrengthened while turning northward near the Bahamas, becoming a hurricane on September 10. Midday on September 11, Gert attained its peak intensity with winds of 105 mph (165 km/h) and a minimum pressure of 988 mbar (hPa; 29.18 inHg). The hurricane turned northeastward and weakened over cooler waters, passing about 100 mi (160 km) north of Bermuda on September 12 as a tropical storm. On September 14, Gert weakened further to tropical depression status, dissipating the next day.[39]
While passing through the Leeward Islands, Gert dropped moderate rainfall of 5.85 inches (148.5 mm) on St. Thomas. Winds gusted to 50 mph (85 km/h) on the island. In Puerto Rico, rainfall peaked at 6.02 inches (153 mm) in the Puerto Rican municipality of Maricao. Gale warnings were issued for the Turks and Caicos Islands and later the southeastern Bahamas, and light rainfall occurred in the region, reaching 3.20 inches (81.28 mm) on the island of San Salvador. Winds were light in Bermuda.[38]
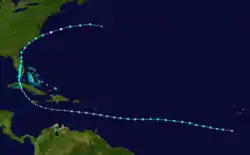
Hurricane Harvey
| Category 4 hurricane (SSHWS) | |
  | |
| Duration | September 11 – September 19 |
|---|---|
| Peak intensity | 130 mph (215 km/h) (1-min) 946 mbar (hPa) |
Harvey formed in the central Atlantic, reaching hurricane strength only a few hours after first becoming a named system on September 12. From its initial position several hundred miles east of the Leeward Islands, Harvey moved northwest. Its path began curving more to the north, and was considered a threat to Bermuda until the continuing curve took Harvey away from the island. Harvey's track became more easterly, and the storm weakened and became extratropical as it approached the Azores. Harvey caused no reported damage, although several ships reported experiencing tropical-storm-force winds.[16]
Tropical Depression Thirteen
| Tropical depression (SSHWS) | |
 | |
| Duration | September 22 – September 24 |
|---|---|
| Peak intensity | 35 mph (55 km/h) (1-min) 998 mbar (hPa) |
The thirteenth tropical depression developed 275 mi (443 km) southwest of Bermuda on September 22,[40] and was initially expected to intensify into a tropical storm.[41] Although it failed to further intensify, Tropical Depression Thirteen brought squalls to Bermuda with winds gusts of tropical storm force as it passed west of the island on September 23. Moving northward, the system merged with a developing extratropical cyclone south of Nova Scotia on September 24.[17]
Hurricane Irene
| Category 3 hurricane (SSHWS) | |
  | |
| Duration | September 21 – October 2 |
|---|---|
| Peak intensity | 120 mph (195 km/h) (1-min) 959 mbar (hPa) |
Satellite imagery detected a tropical disturbance off the coast of Africa on September 19. By September 23, the disturbance had developed a closed circulation and was designated as Tropical Storm Irene.[18] The storm tracked northwest, becoming a hurricane on September 25. Irene then began to curve eastward as it gradually strengthened.[18] On September 28, Irene strengthened into a Category 3 hurricane and reached its peak intensity with maximum sustained winds of 120 mph (195 km/h). Irene then gradually weakened, weakening below hurricane strength on October 1. Early on October 2, Irene became extratropical while located north of the Azores. The remaining extratropical storm moved over France on October 3.[18]
Tropical Depression Fifteen
| Tropical depression (SSHWS) | |
 | |
| Duration | September 27 – October 4 |
|---|---|
| Peak intensity | 35 mph (55 km/h) (1-min) 1010 mbar (hPa) |
This tropical depression formed southwest of the Cape Verde Islands on September 27,[19] and tracked through the deep tropics before weakening as it moved over the Leeward Islands late on September 30. Heavy rains occurred at Guadeloupe as the system passed by the island.[20] The depression then recurved to the south and east of Bermuda late on October 3.
Tropical Storm Jose
| Tropical storm (SSHWS) | |
  | |
| Duration | October 29 – November 1 |
|---|---|
| Peak intensity | 50 mph (85 km/h) (1-min) 998 mbar (hPa) |
Jose was a weak and short-lived tropical storm that formed far from land on October 29. It moved generally northeast before becoming subtropical and then dissipating on November 1 near the Azores.[21]
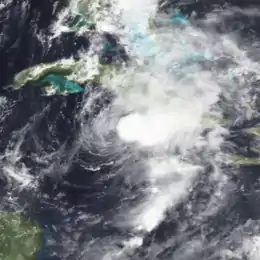
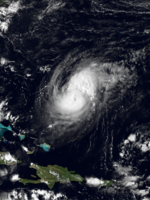
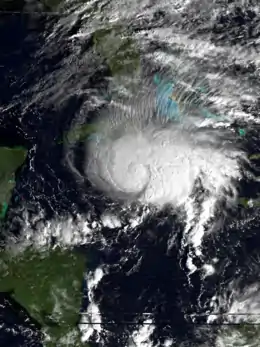
Hurricane Katrina
| Category 1 hurricane (SSHWS) | |
 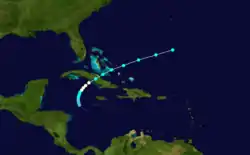 | |
| Duration | November 3 – November 8 |
|---|---|
| Peak intensity | 85 mph (140 km/h) (1-min) 980 mbar (hPa) |
A tropical depression formed on November 3 in the western Caribbean Sea about 150 miles (240 km) south of the Cayman Islands. The depression moved north, reaching tropical storm strength as it moved through the Caymans. Katrina continued to strengthen, reaching hurricane strength half a day before landfall in Cuba. A weakening Katrina moved across eastern Cuba on November 6. After emerging over water, the storm accelerated northeast through the Bahamas. Katrina's circulation fell apart, and the storm merged with a front on November 8.
Hurricane Katrina is reported to have killed two and caused widespread flood damage in Cuba's Camagüey province.[1]
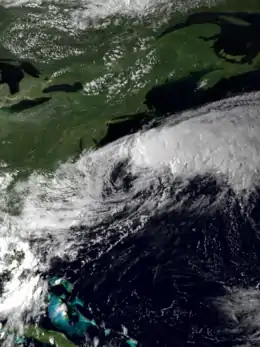
Subtropical Storm Three
| Subtropical storm (SSHWS) | |
  | |
| Duration | November 12 – November 17 |
|---|---|
| Peak intensity | 70 mph (110 km/h) (1-min) 978 mbar (hPa) |
A frontal low over the warm waters of the Gulf Stream organized into a subtropical storm on November 12 while 400 miles (640 km) east of Jacksonville, Florida. After moving northeastward, it turned to the northwest, threatening the northeastern United States as an intensifying subtropical storm that was gradually developing tropical characteristics. A high pressure system turned it to the northeast, and after peaking at 70 mph (110 km/h) it became extratropical near Nova Scotia on November 17. The storm produced significant beach erosion and coastal flooding.[22]
Storm names
The following list of names was used for named storms that formed in the North Atlantic in 1981. It was the first use for all of these names since the post-1978 naming change, except for Arlene, Cindy, and Irene, which had been previously used in 1959, 1963, 1967, and 1971. There were no names retired this year; thus, the same list was used again in the 1987 season.
|
|
Season effects
This is a table of the storms in 1981 and their landfall(s), if any. Deaths in parentheses are additional and indirect (an example of an indirect death would be a traffic accident), but are still storm-related. Damage and deaths include totals while the storm was extratropical or a wave or low.
| Saffir–Simpson scale | ||||||
| TD | TS | C1 | C2 | C3 | C4 | C5 |
| Name | Dates active | Peak classification | Sustained wind speeds |
Pressure | Areas affected | Damage (USD) |
Deaths | Refs |
|---|---|---|---|---|---|---|---|---|
| Unnumbered | April 6 – April 7 | Tropical depression | Unknown | Unknown | None | None | None | |
| Unnumbered | April 19 – April 21 | Tropical depression | Unknown | Unknown | None | None | None | |
| Arlene | May 6 – May 9 | Tropical storm | 60 mph (95 km/h) | 999 hPa (29.50 inHg) | Cuba, Bahamas | Minimal | None | |
| Two | June 3 – June 5 | Tropical depression | 35 mph (55 km/h) | 1002 hPa (29.59 inHg) | Texas | $4 million | 3 | [3] |
| Unnumbered | June 17 – June 19 | Tropical depression | 35 mph (55 km/h) | Unknown | None | None | None | |
| Bret | June 29 – July 1 | Tropical storm | 70 mph (110 km/h) | 996 hPa (29.41 inHg) | Virginia | Minimal | 1 | |
| Unnumbered | July 2 – July 4 | Tropical depression | 35 mph (55 km/h) | Unknown | None | None | None | |
| Four | July 25 – July 26 | Tropical depression | 35 mph (55 km/h) | 1008 hPa (29.77 inHg) | Mexico | None | None | |
| Cindy | August 2 – August 5 | Tropical storm | 60 mph (95 km/h) | 1002 hPa (29.59 inHg) | None | None | None | |
| Dennis | August 7 – August 21 | Category 1 hurricane | 80 mph (130 km/h) | 995 hPa (29.38 inHg) | Cuba, Florida | $15 million | None | |
| Seven | August 17 – August 21 | Tropical depression | 35 mph (55 km/h) | 1007 hPa (29.74 inHg) | None | None | None | |
| Eight | August 26 – August 29 | Tropical depression | 35 mph (55 km/h) | 1004 hPa (29.65 inHg) | Mexico | $21 million | 5 | [10][42] |
| Emily | August 31 – September 11 | Category 1 hurricane | 90 mph (150 km/h) | 966 hPa (28.53 inHg) | None | None | None | |
| Floyd | September 3 – September 12 | Category 3 hurricane | 115 mph (185 km/h) | 975 hPa (28.79 inHg) | None | None | None | |
| Gert | September 7 – September 15 | Category 2 hurricane | 105 mph (165 km/h) | 988 hPa (29.18 inHg) | Puerto Rico | None | None | |
| Harvey | September 11 – September 19 | Category 4 hurricane | 130 mph (215 km/h) | 946 hPa (27.94 inHg) | None | None | None | |
| Thirteen | September 22 – September 24 | Tropical depression | 35 mph (55 km/h) | 998 hPa (29.47 inHg) | Bermuda | None | None | |
| Irene | September 21 – October 2 | Category 3 hurricane | 120 mph (195 km/h) | 959 hPa (28.32 inHg) | None | None | None | |
| Fifteen | September 27 – October 4 | Tropical depression | 35 mph (55 km/h) | 1010 hPa (29.83 inHg) | Leeward Islands | None | None | |
| Jose | October 29 – November 2 | Tropical storm | 50 mph (85 km/h) | 998 hPa (29.47 inHg) | None | None | None | |
| Katrina | November 3 – November 7 | Category 1 hurricane | 85 mph (140 km/h) | 980 hPa (28.94 inHg) | Cuba, Bahamas | Minimal | 2 | |
| Three | November 12 – November 17 | Subtropical storm | 70 mph (110 km/h) | 978 hPa (28.88 inHg) | None | None | None | |
| Season aggregates | ||||||||
| 22 cyclones | April 6 -November 17 | 135 mph (217 km/h) | 946 hPa (27.9 inHg) | $40 million | 11 | |||
See also
- List of Atlantic hurricanes
- Atlantic hurricane season
- 1981 Pacific hurricane season
- 1981 Pacific typhoon season
- 1981 North Indian Ocean cyclone season
- Southern Hemisphere tropical cyclone seasons: 1980–81, 1981–82
References
- Miles B. Lawrence. Preliminary Report Hurricane Katrina: 3 – November 7, 1981. Retrieved on May 17, 2008.
- Joe Pellisier (1981). "Preliminary Report Tropical Storm Arlene: May 6–9, 1981". National Hurricane Center. Retrieved December 6, 2011.
- David M. Roth (August 4, 2008). "Tropical Depression Two – June 4–7, 1981". Hydrometeorological Prediction Center. Retrieved December 6, 2011.
- Miles B. Lawrence (July 11, 1981). "Preliminary Report Tropical Storm Bret: 29 June – 1 July 1981". National Hurricane Center. Retrieved December 6, 2011.
- David M. Roth (August 4, 2008). "Tropical Depression Four – July 24–30, 1981". Hydrometeorological Prediction Center. Retrieved December 6, 2011.
- John Hope. Preliminary Report Tropical Storm Cindy: 2 – August 5, 1981. Retrieved on May 17, 2008
- David M. Roth. Hurricane Dennis – August 15–20, 1981. Retrieved on May 12, 2008.
- United Press International. Dennis Could Still Become a Hurricane. Archived January 8, 2016, at the Wayback Machine Retrieved on May 18, 2008.
- United Press International. Tropical Depression Fizzles. Archived January 8, 2016, at the Wayback Machine Retrieved on May 18, 2008.
- David M. Roth. Tropical Depression Eight – August 27 – September 1, 1981. Retrieved on May 12, 2008.
- Gil Clark. Preliminary Report Hurricane Emily: August 31 – September 11. Retrieved on May 17, 2008.
- Pellisier, Joe; National Hurricane Center (1982). Hurricane Floyd (Preliminary Report). United States National Oceanic and Atmospheric Administration's National Weather Service. Retrieved May 13, 2012.
- David M. Roth. Tropical Storm Gert – September 7–9, 1981. Retrieved on May 12, 2008.
- Miles B. Lawrence. Preliminary Report Hurricane Gert: 07 – September 15, 1981. Page 1. Retrieved on May 17, 2008.
- Miles B. Lawrence. Preliminary Report Hurricane Gert: 07 – September 15, 1981. Page 2. Retrieved on May 17, 2008.
- John Hope. Preliminary Report Hurricane Harvey: 11 – September 19, 1981. Retrieved on May 17, 2008.
- Associated Press. Irene expected to become hurricane. Archived January 8, 2016, at the Wayback Machine Retrieved on May 16, 2008.
- National Hurricane Center. Preliminary Report Hurricane Irene: September 21 – October 3, 1981. Retrieved on May 17, 2008.
- Associated Press. 110 MPH Winds Whip Up Atlantic. Archived January 8, 2016, at the Wayback Machine Retrieved on May 18, 2008.
- United Press International. Hurricane, Depression Pack Little Punch. Archived January 8, 2016, at the Wayback Machine Retrieved on May 18, 2008.
- Miles B. Lawrence. Preliminary Report Tropical Storm Jose: October 29 – November 1, 1981. Retrieved on May 17, 2008.
- Miles B. Lawrence. Preliminary Report Subtropical Storm (Number Two?). Retrieved on May 17, 2008.
- Hurricane Research Division (March 2011). "Atlantic basin Comparison of Original and Revised HURDAT". National Oceanic and Atmospheric Administration. Retrieved July 23, 2011.
- National Oceanic and Atmospheric Administration (May 27, 2010). "Background information: the North Atlantic Hurricane Season". Climate Prediction Center. Archived from the original on May 10, 2011. Retrieved March 30, 2011.
- David Levinson (August 20, 2008). "2005 Atlantic Ocean Tropical Cyclones". National Climatic Data Center. Retrieved July 23, 2011.
- "Atlantic hurricane best track (HURDAT version 2)" (Database). United States National Hurricane Center. May 25, 2020.
- Bill Blum (June 5, 1981). Storm Report (Report). National Weather Service Galveston, Texas. Retrieved February 20, 2020.
- Teri Crook (June 6, 1981). "Excessive rainfall paralyzes Texas City residents". The Galveston Daily News. p. 1A. Retrieved February 20, 2020 – via Newspapers.com.

- Storm Report (Report). National Weather Service Alexandria, Louisiana. June 5, 1981. Retrieved February 20, 2020.
- "At least three people were killed and a dozen..." United Press International. June 5, 1981. Retrieved February 20, 2020.
- David M. Roth. Tropical Storm Bret (1981) Color-Filled Rainfall Graphic with a Black Background. Retrieved on June 6, 2008.
- National Climatic Data Center. July 24, 1981 18:00 UTC Channel: Visible (~0.65um) Satellite: GOES-4. Retrieved on May 13, 2008.
- National Hurricane Center. Preliminary Report Hurricane Dennis: 7 – August 21, 1981. Page 1. Retrieved on May 17, 2008.
- National Hurricane Center. Preliminary Report Hurricane Dennis: 7 – August 21, 1981. Page 2. Retrieved on May 17, 2008.
- John Patton. Data and Descriptions of Selected Substantial Storms and Floods as Documented by John Patton. Retrieved on May 11, 2008.
- The Galveston Daily News. Summary of Storm Activity. Archived January 8, 2016, at the Wayback Machine Retrieved on May 13, 2008.
- Federal Emergency Management Agency. Significant Flood Events: 1978 – March 31, 2008. Retrieved on May 11, 2008. Archived February 1, 2008, at the Wayback Machine
- Lawrence, Miles (October 10, 1981). "Hurricane Gert Preliminary Report. Page 1". National Hurricane Center. Retrieved June 11, 2010.
- Lawrence, Miles (October 10, 1981). "Hurricane Gert Preliminary Report. Page 2". National Hurricane Center. Retrieved June 11, 2010.
- "13th Tropical Depression Of Year Forms". Sarasota Herald-Tribune. September 23, 1981. Retrieved November 12, 2010.
- "Tropical depression aims at Bermuda". The Miami News. September 23, 1981. Retrieved November 12, 2010.
- Federal Emergency Management Agency