1983 Atlantic hurricane season
The 1983 Atlantic hurricane season holds a record for the lowest number of confirmed storms in the modern satellite era that began in 1967, with only 4 named storms forming. The season was also the least active season since 1930.[1] The season officially began on June 1, 1983, and lasted until November 30, 1983. These dates conventionally delimit the period of each year when most storms form in the Atlantic basin. The season had very little activity, with only seven tropical depressions, four of which reached tropical storm strength or higher. This led to the lowest Accumulated Cyclone Energy count since 1950, but not since 1900.
| 1983 Atlantic hurricane season | |
|---|---|
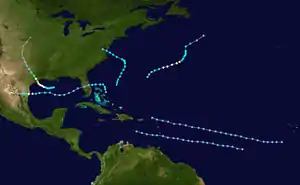 Season summary map | |
| Seasonal boundaries | |
| First system formed | July 23, 1983 |
| Last system dissipated | September 30, 1983 |
| Strongest storm | |
| Name | Alicia |
| • Maximum winds | 115 mph (185 km/h) (1-minute sustained) |
| • Lowest pressure | 962 mbar (hPa; 28.41 inHg) |
| Seasonal statistics | |
| Total depressions | 7 |
| Total storms | 4 (Record low in the satellite era) |
| Hurricanes | 3 |
| Major hurricanes (Cat. 3+) | 1 |
| Total fatalities | 22 total |
| Total damage | $3 billion (1983 USD) |
| Related articles | |
The season began later than normal; the first tropical depression formed on July 29[2] and the second on July 31. Neither tropical depressions strengthened and they dissipated soon thereafter. Hurricane Alicia formed as Tropical Depression Three on August 15, quickly intensified into a hurricane on August 16 and made landfall in Texas on August 18. Alicia caused $3 billion in damage in Texas. Hurricane Barry formed on August 25, crossed Florida and strengthened into a hurricane. Barry made landfall near the Mexico–United States border, and dissipated over land on August 30.
Hurricane Chantal, the third and final hurricane in 1983, formed on September 10. It strengthened into a hurricane, but stayed out at sea, and became absorbed by a front on September 15. Tropical Depression Six formed on September 19 and caused heavy rains in the Caribbean before degenerating into a wave on September 21. Tropical Storm Dean was the final storm of the season, forming on September 26. It originally tracked to the north, peaking at 55 mph (89 km/h) winds (85 km/h), and made landfall in the Delmarva Peninsula on September 29. It dissipated over the coast of Virginia on September 30.
Seasonal forecasts
| Source | Date | Named storms |
Hurricanes | Major hurricanes |
| CSU[3] | July 23 | 8 | 5 | Unknown |
| Record high activity | 30 | 15 | 7 | |
| Record low activity | 1 | 0 (tie) | 0 | |
| Actual activity | 4 | 3 | 1 | |
Forecasts of hurricane activity are issued before each hurricane season by noted hurricane experts like Dr. William M. Gray, and his associates at Colorado State University. A normal season, as defined by the National Oceanic and Atmospheric Administration (NOAA), has six to fourteen named storms, with four to eight of those reaching hurricane strength, and one to three major hurricanes.
The July 23, 1983 forecast predicted that after the slow start to the season, that a total of eight storms would form, and five of the storms would reach hurricane status. The forecast did not specify how many of the hurricanes would reach major hurricane status.[3] However, the predictions proved to be too high, with only four named storms forming by the end of the season and three of those reaching hurricane status.[2]
Seasonal summary

The season, which began on June 1 and ended on November 30, was very inactive because of strong upper-level wind shear.[2] The wind shear was unusually strong throughout the Caribbean and open Atlantic, and disrupted convection in areas of disturbed weather so they could not develop. Over sixty African systems had formed and made it westward, but when they reached the Lesser Antilles, they were dissolved easily. The only area where the shear was minimal—a region encompassing the Gulf of Mexico and the Atlantic north of the Bahamas and east of Florida—was where the four named storms developed. Another contributing factor to the low number of storms may have been the decaying 1982-83 El Niño event. The season-long total of 4 named storms makes the 1983 season the least active season since the 1930 Atlantic hurricane season which had only two storms.[2] 1983 and the prior season became the first example of two consecutive years to have no storms form in the Caribbean Sea since 1871, when reliable record began.[2] 1983 also proved to be the first season since 1871 that a storm did not form south of 25°N latitude.[2]
1983 was the first season for which the National Hurricane Center issued numeric landfall probabilities. Probabilities had been calculated for prior storms for use in the issuing of hurricane watches and warnings, but this was the first time the raw numeric probabilities were released to the public.[2] The probabilities issued were accurate during Alicia, indicating that Galveston and surrounding portions of the upper Texas coast were the most likely area to be struck.[4]
The season's activity was reflected with a very low cumulative accumulated cyclone energy (ACE) rating of 17, one of the lowest on record,[5] which is classified as "below normal".[6] ACE is, broadly speaking, a measure of the power of the hurricane multiplied by the length of time it existed, so storms that last a long time, as well as particularly strong hurricanes, have high ACEs. ACE is only calculated for full advisories on tropical systems at or exceeding 34 knots (39 mph, 63 km/h) or tropical storm strength. Subtropical cyclones are excluded from the total.[7]
Systems
Tropical Depression One
| Tropical depression (SSHWS) | |
.jpg.webp) | |
| Duration | July 23 – July 28 |
|---|---|
| Peak intensity | 35 mph (55 km/h) (1-min) |
Tropical Depression One formed from a tropical disturbance near the Lesser Antilles on July 29.[8] The National Hurricane Center indicated the possibility of the depression strengthening into a tropical storm in media reports but upper-level wind shear inhibited any development.[2][9] The depression dissipated the next day.[2]
Tropical Depression Two
| Tropical depression (SSHWS) | |
 | |
| Duration | July 27 – August 2 |
|---|---|
| Peak intensity | 35 mph (55 km/h) (1-min) |
An area of disturbed weather in the central Atlantic managed to gain enough organization to be designated Tropical Depression Two on July 31. The depression moved across the Atlantic without strengthening due to high upper-level wind shear, and dissipated near the Lesser Antilles on August 3.[10][11]
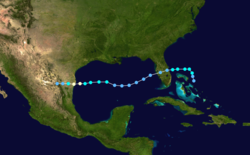
Hurricane Alicia
| Category 3 hurricane (SSHWS) | |
  | |
| Duration | August 15 – August 20 |
|---|---|
| Peak intensity | 115 mph (185 km/h) (1-min) 962 mbar (hPa) |
The system that would become Hurricane Alicia originated from the western end of a frontal trough that stretched from New England to the Gulf of Mexico.[12] Satellite pictures showed a meso-scale low pressure area that had moved off the Alabama and Mississippi coasts near the trough and was possibly the precursor system to Alicia. Pressures in the Gulf of Mexico were high and stayed high during the early development stages. On August 15, a ship recorded a minimal pressure of 1015 millibars (29.99 inHg), when the system was upgraded into Tropical Storm Alicia. With high environmental pressures around it, Alicia remained a small system.[12]
Steering currents above Alicia remained weak during the storm's lifetime.[12] However, a ridge was well formed to the north of the developing storms. With fluctuations in the pressures, Alicia began to drift to west on August 16. This was short-lived, as Alicia turned to the northwest towards Texas. During the period of August 16 to August 18, an anticyclone had formed over Alicia and along with slow movement over warm waters, caused Alicia to intensify rapidly. The pressure in Alicia decreased one millibar an hour in the 40 hours before landfall. Alicia peaked at 115 mph (185 km/h) in winds and 962 millibars (28.39 inHg) in pressure on August 18. Alicia made landfall near Galveston on August 18 as a Category 3 hurricane. Alicia weakened quickly over land and accelerated over the Midwest, before dissipating over Nebraska on August 21.[12]
As Alicia moved northward, the remnants caused moderate to heavy rainfall in several states.[13] Houston suffered heavy damage, including thousands of shattered glass panes from downtown skyscrapers. Overall, Alicia killed 22 people and caused $3 billion (1983 USD) in damage.[13][14][15]
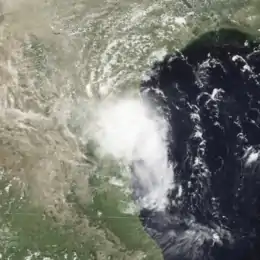
Hurricane Barry
| Category 1 hurricane (SSHWS) | |
  | |
| Duration | August 23 – August 29 |
|---|---|
| Peak intensity | 80 mph (130 km/h) (1-min) 986 mbar (hPa) |
Hurricane Barry originated from a tropical disturbance that left the Northwestern African coast on August 13.[16] Most of the season, the northwestern tropical Atlantic Ocean had upper-level wind shear, which had inhibited development of systems. Due to these conditions, the disturbance was unable to strengthen until August 22 as it was approaching the Bahamas. A weak trough moved the disturbance into an area of low wind shear, and the disturbance intensified into Tropical Depression Four on the evening of August 23. The depression was just to the northeast of the northern Bahamian Islands where it strengthened into Tropical Storm Barry on the morning of August 24.[16]
Tropical Storm Barry subsequently turned to the west into an area of increased wind shear and weakened rapidly.[16] It was able to make landfall near Melbourne, Florida, on the morning of August 25 as a 45 mph tropical storm, before weakening to a tropical depression over Florida. After Tropical Depression Barry emerged from central Florida, it was still under pressure from high-level winds. The depression entered the central Gulf of Mexico, and after meandering west for a day or so, returned to tropical storm strength. Just off the coast of Mexico, Barry rapidly intensified into a hurricane on August 28, just before making landfall near Matamoros that afternoon. Before landfall, Barry peaked with 80 mph (130 km/h) winds and a pressure of 986 millibars (29.11 inHg). The remnants quickly dissipated over the Sierra Madre Oriental on August 29.[16]
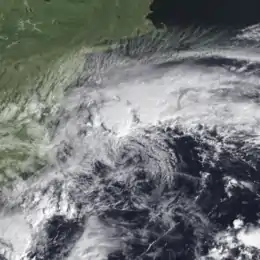
Hurricane Chantal
| Category 1 hurricane (SSHWS) | |
  | |
| Duration | September 10 – September 15 |
|---|---|
| Peak intensity | 75 mph (120 km/h) (1-min) 994 mbar (hPa) |
The precursor low to Chantal originated from a large envelope of low pressure on the morning of September 10.[17] The disturbed weather, nested off the coast of Bermuda, was one of the remnants of an old frontal trough that had extended from Hispaniola to the central north Atlantic Ocean. This particular area of disturbed weather become part of the northeast portion of a low-pressure system. On September 10, a reconnaissance aircraft found sustained winds of 30 mph (50 km/h) and a 1010 millibar (29.83 inHg) pressure reading, indicating development into a tropical depression.[17]
The depression moved to within 100 miles (160 kilometers) of Bermuda and slowly intensified.[17] Late that afternoon, Tropical Depression Five had intensified into a 40 mph (60 km/h) storm and was named Chantal. Chantal intensified rapidly, intensifying to hurricane status late on September 11. It then turned to the east and gained a weak upper-level cirrus-cloud outflow. The structure of the system changed little over the next 24 hours, before Chantal lost organization and was downgraded to a tropical storm on the night of the 12th.[17]
Overnight, all convection in Chantal dissipated, and its forward speed decreased as it headed north.[17] A frontal system attracted and absorbed the remnants of Chantal by the night of September 14. Effects on Bermuda were minimal, with the island getting winds only up to 20 mph (25 km/h) and a few thundershowers.[17] However, Chantal generated swells of 30–40 ft (9–12 m) offshore.[18]
Tropical Depression Six
| Tropical depression (SSHWS) | |
 | |
| Duration | September 19 – September 21 |
|---|---|
| Peak intensity | 35 mph (55 km/h) (1-min) |
Tropical Depression Six formed on September 19 from a tropical wave. The depression caused heavy rainfall in the Lesser Antilles[19] before degenerating into an open tropical wave on September 21 near the Dominican Republic.[20]
Tropical Storm Dean
| Tropical storm (SSHWS) | |
  | |
| Duration | September 26 – September 30 |
|---|---|
| Peak intensity | 65 mph (100 km/h) (1-min) 999 mbar (hPa) |
Tropical Storm Dean originated from inside a frontal cloud band, which had moved off the Eastern Coast of the United States on September 22.[21] During the next few days, the band became stationary from the Bahamas to beyond Bermuda. During this period, a 1035 millibar (30.56 inHg) high pressure cell had become settled over the northeastern United States. This resulted in a strong pressure gradient and winds near gale force along the eastern coast.[21]
A low-level circulation formed from the frontal cloud band on September 26 about 460 miles (740 km) east of central Florida.[21] Dean was first identified on the afternoon of September 26 as a subtropical storm. An Air Force reconnaissance flight was sent to Dean on September 27 and only reported winds of 35 mph (55 km/h) at 23 miles (37 kilometres) from the center. A pressure of 999 millibars (29.50 inHg) indicated that Dean was strengthening as it headed northward. Additionally, satellite pictures showed that the subtropical cyclone was emerging from the cloud. This data also showed that the storm was gaining tropical characteristics and was given the name Dean on the afternoon of September 27.[21]
Dean's winds peaked at 65 mph (105 km/h) on September 28 as it headed northward.[21] Dean's circulation turned to the northwest on September 29 then made landfall in the Delmarva Peninsula and dissipated over land on September 30.[21] Gale warnings were from North Carolina to Rhode Island in association with Dean.[22] Dean produced rainfall spreading from the North Carolina/Virginia border all the way to New England. Virginia reported rains of 1 inch (25.4 mm) with 3 inches (76.2 mm) at the border.[23] Rains peaked at 4.62 inches (117 mm) at Cockaponset Ranger Station in Connecticut.[23] Damage was limited to minor beach erosion and flooding along the portion of Mid-Atlantic coast states.[21]
Storm names
The following list of names was used for named storms that formed in the North Atlantic in 1983. The names not retired from this list were used again in the 1989 season. This year marked the first usage for this list of names in the North Atlantic basin. The names Alicia, Barry, Chantal, and Dean were used for the first (and only, in the case of Alicia) time this year.
|
|
Retirement
In the spring of 1984, at the 6th session of the RA IV hurricane committee, the World Meteorological Organization retired the name Alicia from its rotating name lists due to the amount of damage and deaths it caused, and it will not be used again for another Atlantic hurricane.[24] Alicia was replaced with Allison for the 1989 season.[25]
Season effects
This is a table of the storms in 1983 and their landfall(s), if any. Deaths in parentheses are additional and indirect (an example of an indirect death would be a traffic accident), but are still storm-related. Damage and deaths include totals while the storm was extratropical or a wave or low.
| Saffir–Simpson scale | ||||||
| TD | TS | C1 | C2 | C3 | C4 | C5 |
| Name | Dates active | Peak classification | Sustained wind speeds |
Pressure | Areas affected | Damage (USD) |
Deaths | Refs |
|---|---|---|---|---|---|---|---|---|
| One | July 23 – 28 | Tropical depression | 35 mph (55 km/h) | Not Specified | None | None | None | [26][9] |
| Two | July 27 – August 2 | Tropical depression | 35 mph (55 km/h) | Not Specified | None | None | None | [11][26] |
| Alicia | August 15 – 20 | Category 3 hurricane | 115 mph (185 km/h) | 962 hPa (28.41 inHg) | Eastern Texas, Central United States | $3 billion | 21 | [14][27][15] |
| Barry | August 23 – 29 | Category 1 hurricane | 80 mph (130 km/h) | 986 hPa (29.12 inHg) | United States Gulf Coast, Mexico | Minor | None | |
| Chantal | September 10 – 15 | Category 1 hurricane | 75 mph (120 km/h) | 994 hPa (29.35 inHg) | None | None | None | |
| Six | September 19 – 21 | Tropical depression | 35 mph (55 km/h) | Not Specified | None | None | None | [19][26] |
| Dean | September 26 – 30 | Tropical storm | 65 mph (100 km/h) | 999 hPa (29.50 inHg) | United States East Coast | Minor | None | |
| Season aggregates | ||||||||
| 7 systems | July 23 – September 30 | 115 mph (185 km/h) | 962 hPa (28.41 inHg) | $3 billion | 21 | |||
See also
- List of Atlantic hurricanes
- Atlantic hurricane season
- 1983 Pacific hurricane season
- 1983 Pacific typhoon season
- 1983 North Indian Ocean cyclone season
- Southern Hemisphere tropical cyclone seasons: 1982–83, 1983–84
References
- John Arnold (November 30, 1983). "Hurricane season ends weakly". The Philadelphia Inquirer. Archived from the original on October 4, 2012. Retrieved December 16, 2007.
- Robert Case and Harold Gerrish (1984). "1983 Monthly Weather Review" (PDF). American Meteorological Society. Archived (PDF) from the original on January 2, 2014. Retrieved February 2, 2007.
- Mary Vorobril (July 23, 1983). "Five-hurricane season predicted new—though fallible—technique also forecasts a busy 1984 period". Miami Herald. p. 3A. Archived from the original on June 9, 2011. Retrieved December 26, 2007.
- National Hurricane Center (1983). "Hurricane Alicia Preliminary Report Page 3". National Hurricane Center. Archived from the original on October 20, 2012. Retrieved February 2, 2007.
- Hurricane Research Division (March 2011). "Atlantic basin Comparison of Original and Revised HURDAT". National Oceanic and Atmospheric Administration. Archived from the original on November 29, 2011. Retrieved July 23, 2011.
- National Oceanic and Atmospheric Administration (May 27, 2010). "Background information: the North Atlantic Hurricane Season". Climate Prediction Center. Archived from the original on May 10, 2011. Retrieved March 30, 2011.
- David Levinson (August 20, 2008). "2005 Atlantic Ocean Tropical Cyclones". National Climatic Data Center. Archived from the original on December 1, 2005. Retrieved July 23, 2011.
- Liz Balmaseda (July 29, 1983). "2 days of rain cause a dip in temperatures". Miami Herald. Archived from the original on June 9, 2011. Retrieved February 7, 2007.
- "Forecast: 90s, humid, but rest of U.S. will be hotter". Associated Press. July 29, 1983.
- Liz Balmaseda (July 31, 1983). "Depression has good chance of being first tropical storm". Miami Herald. Archived from the original on June 9, 2011. Retrieved February 2, 2007.
- Miami Herald (August 3, 1983). "2nd tropical depression withers". Miami Herald. Archived from the original on June 9, 2011. Retrieved February 2, 2007.
- National Hurricane Center (1983). "Hurricane Alicia Preliminary Report Page 1". National Hurricane Center. Archived from the original on October 20, 2012. Retrieved February 2, 2007.
- David Roth (2007). "Tropical Cyclone Rainfall: Hurricane Alicia". Hydrometeorological Prediction Center. Archived from the original on September 22, 2013. Retrieved February 2, 2007.
- "Hurricane Alicia: Prediction, Damage & Recovery Efforts" (PDF). Subcommittee on Natural Resources, Agriculture Research and Environment. 1983. Archived from the original (PDF) on May 5, 2011. Retrieved May 5, 2011.
- Costliest U.S. tropical cyclones tables updated (PDF) (Report). Miami, Florida: National Hurricane Center. January 26, 2018. Archived (PDF) from the original on January 26, 2018. Retrieved February 4, 2018.
- National Hurricane Center (1983). "Hurricane Barry Preliminary Report". National Hurricane Center. Archived from the original on October 19, 2012. Retrieved December 23, 2007.
- National Hurricane Center (1983). "Hurricane Chantal Preliminary Report". National Hurricane Center. Archived from the original on October 20, 2012. Retrieved February 2, 2007.
- The Philadelphia Inquirer (September 12, 1983). "Hurricane Chantal bypasses Bermuda". The Philadelphia Inquirer. Archived from the original on June 9, 2011. Retrieved February 3, 2007.
- Miami Herald (September 19, 1983). "New tropical depression forms aims toward Windwards". Miami Herald. Archived from the original on June 9, 2011. Retrieved February 2, 2007.
- Miami Herald (September 21, 1983). "Caribbean storm downgraded". Miami Herald. Archived from the original on June 9, 2011. Retrieved February 2, 2007.
- Miles B. Lawrence (October 14, 1983). "Tropical Storm Dean Preliminary Report". National Hurricane Center. Archived from the original on October 2, 2015. Retrieved February 2, 2007.
- Miles B. Lawrence (October 14, 1983). "Tropical Storm Dean Preliminary Report – Page 2". National Hurricane Center. Archived from the original on October 2, 2015. Retrieved December 21, 2007.
- David Roth (2007). "Tropical Cyclone Rainfall: Tropical Storm Dean". Hydrometeorological Prediction Center. Archived from the original on February 16, 2015. Retrieved February 2, 2007.
- "Retired Hurricane Names Since 1954". Miami, Florida: National Hurricane Center. 2018. Archived from the original on June 28, 2011. Retrieved August 17, 2018.
- National Hurricane Operations Plan (1988) (PDF) (Report). U.S Department of Commerce. May 1988. Archived (PDF) from the original on May 21, 2017. Retrieved October 14, 2018.
- "Atlantic hurricane best track (HURDAT version 2)" (Database). United States National Hurricane Center. May 25, 2020.
- Case, Robert A; Gerrish, Harold P (May 1, 1984). "Atlantic Hurricane Season of 1983". Monthly Weather Review. American Meteorological Society. 112 (5): 1083–1092. Bibcode:1984MWRv..112.1083C. doi:10.1175/1520-0493(1984)112<1083:AHSO>2.0.CO;2. ISSN 1520-0493.