1985 Northumberland County Council election
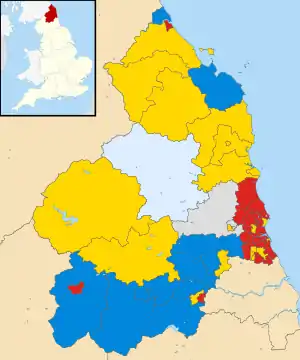
Local elections to Northumberland County Council, a county council in the north east of England, were held on 2 May 1985. The Labour Party lost overall control of the council, which fell under no overall control.
| ||||||||||||||||||||||||||||||||||||||||||||||||||||||
All 66 seats to Northumberland County Council 34 seats needed for a majority | ||||||||||||||||||||||||||||||||||||||||||||||||||||||
|---|---|---|---|---|---|---|---|---|---|---|---|---|---|---|---|---|---|---|---|---|---|---|---|---|---|---|---|---|---|---|---|---|---|---|---|---|---|---|---|---|---|---|---|---|---|---|---|---|---|---|---|---|---|---|
| Turnout | 41.0% | |||||||||||||||||||||||||||||||||||||||||||||||||||||
| ||||||||||||||||||||||||||||||||||||||||||||||||||||||
 Map of the results of the 1985 local election. | ||||||||||||||||||||||||||||||||||||||||||||||||||||||
| ||||||||||||||||||||||||||||||||||||||||||||||||||||||
Results
| Party | Seats | Gains | Losses | Net gain/loss | Seats % | Votes % | Votes | +/− | |
|---|---|---|---|---|---|---|---|---|---|
| Labour | 30 | 45.5 | 37.5 | 35,498 | |||||
| Alliance | 20a | 30.3 | 35.5b | 33,570 | |||||
| Conservative | 12 | 18.2 | 20.5 | 19,400 | |||||
| Independent | 3 | 4.5 | 6.4 | 5,097 | |||||
| Ind. Conservative | 1 | 1.5 | 0.9 | 851 | New | ||||
| Ecology | 0 | 0.0 | 0.1 | 135 | New | ||||
References
- "Local Election Summaries 1985". The Elections Centre. Retrieved 21 June 2019.
- p.593
- County Council Results
External links
This article is issued from Wikipedia. The text is licensed under Creative Commons - Attribution - Sharealike. Additional terms may apply for the media files.