1991 Rhineland-Palatinate state election
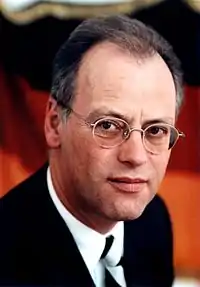
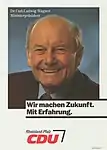
The 1991 Rhineland-Palatinate state election was held on 21 April 1991 to elect the members of the Landtag of Rhineland-Palatinate. The incumbent coalition government of the Christian Democratic Union (CDU) and Free Democratic Party (FDP) led by Minister-President Carl-Ludwig Wagner was defeated, losing its majority. The Social Democratic Party (SPD) moved into first place, forming a coalition with the FDP. SPD leader Rudolf Scharping was subsequently elected as Minister-President.
| ||||||||||||||||||||||||||||||||||||||||||||||||||||||||
All 101 seats of the Landtag of Rhineland-Palatinate 51 seats needed for a majority | ||||||||||||||||||||||||||||||||||||||||||||||||||||||||
|---|---|---|---|---|---|---|---|---|---|---|---|---|---|---|---|---|---|---|---|---|---|---|---|---|---|---|---|---|---|---|---|---|---|---|---|---|---|---|---|---|---|---|---|---|---|---|---|---|---|---|---|---|---|---|---|---|
| Turnout | 2,125,407 (73.9%) | |||||||||||||||||||||||||||||||||||||||||||||||||||||||
| ||||||||||||||||||||||||||||||||||||||||||||||||||||||||
| ||||||||||||||||||||||||||||||||||||||||||||||||||||||||
Parties
The table below lists parties represented in the previous Landtag of Rhineland-Palatinate.
| Name | Ideology | Leader(s) | 1987 result | |||
|---|---|---|---|---|---|---|
| Votes (%) | Seats | |||||
| CDU | Christian Democratic Union of Germany Christlich Demokratische Union Deutschlands |
Christian democracy | Carl-Ludwig Wagner | 45.1% | 48 / 101 | |
| SPD | Social Democratic Party of Germany Sozialdemokratische Partei Deutschlands |
Social democracy | Rudolf Scharping | 38.8% | 40 / 101 | |
| FDP | Free Democratic Party Freie Demokratische Partei |
Classical liberalism | 7.3% | 7 / 101 | ||
| Grüne | Alliance 90/The Greens Bündnis 90/Die Grünen |
Green politics | 5.9% | 5 / 101 | ||
Election result
Summary of the 21 April 1991 election results for the Landtag of Rhineland-Palatinate
| Party | Votes | % | +/- | Seats | +/- | Seats % | |
|---|---|---|---|---|---|---|---|
| Social Democratic Party (SPD) | 951,695 | 44.8 | 47 | 46.5 | |||
| Christian Democratic Union (CDU) | 822,449 | 38.7 | 40 | 39.6 | |||
| Free Democratic Party (FDP) | 146,400 | 6.9 | 7 | 6.9 | |||
| Alliance 90/The Greens (Grüne) | 137,139 | 6.5 | 7 | 6.9 | |||
| The Republicans (REP) | 43,380 | 2.0 | 0 | ±0 | 0 | ||
| Others | 24,244 | 1.1 | 0 | ±0 | 0 | ||
| Total | 2,125,407 | 100.0 | 101 | ||||
| Voter turnout | 73.9 | ||||||
This article is issued from Wikipedia. The text is licensed under Creative Commons - Attribution - Sharealike. Additional terms may apply for the media files.

