2002 Stevenage Borough Council election
Elections to Stevenage Borough Council were held on 2 May 2002. One third of the council was up for election; the seats of the candidates who finished second in each ward in the all-out election of 1999. The Labour party stayed in overall control of the council, which it had held continuously since 1973.
| |||||||||||||||||||||||||||||||||
13 of the 39 seats to Stevenage Borough Council 20 seats needed for a majority | |||||||||||||||||||||||||||||||||
|---|---|---|---|---|---|---|---|---|---|---|---|---|---|---|---|---|---|---|---|---|---|---|---|---|---|---|---|---|---|---|---|---|---|
| |||||||||||||||||||||||||||||||||
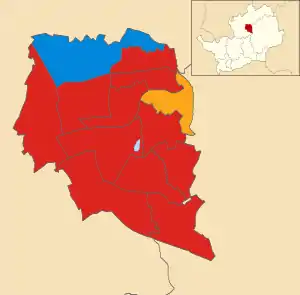 Map showing the results of contested wards in the 2002 Stevenage Borough Council elections. | |||||||||||||||||||||||||||||||||
| |||||||||||||||||||||||||||||||||
After the election, the composition of the council was
- Labour 33
- Liberal Democrat 3
- Conservative 3
Election result
| Party | Seats | Gains | Losses | Net gain/loss | Seats % | Votes % | Votes | +/− | |
|---|---|---|---|---|---|---|---|---|---|
| Labour | 11 | 0 | 84.6 | 53.2 | 16,392 | ||||
| Conservative | 1 | 0 | 7.7 | 26.1 | 8,027 | ||||
| Liberal Democrats | 1 | 0 | 7.7 | 18.7 | 5,747 | ||||
| Green | 0 | 0 | 0 | 1.7 | 517 | ||||
| Socialist Alternative | 0 | 0 | 0 | 0.4 | 116 | ||||
Ward results
Bandley Hill
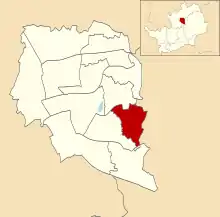
Location of Bandley Hill ward
| Party | Candidate | Votes | % | |
|---|---|---|---|---|
| Labour | Joan Lloyd | 1,512 | 66.0 | |
| Conservative | Freda Warner | 778 | 34.0 | |
| Majority | 734 | 32.0 | ||
| Turnout | 2,290 | |||
Bedwell
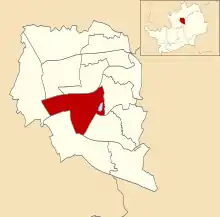
Location of Bedwell ward
| Party | Candidate | Votes | % | |
|---|---|---|---|---|
| Labour | Brian Underwood | 1,616 | 64.2 | |
| Conservative | Ralph Dimelow | 448 | 17.8 | |
| Liberal Democrats | Leonard Lambert | 336 | 13.4 | |
| Socialist Alternative | Stephen Glennon | 116 | 4.6 | |
| Majority | 1,168 | 46.4 | ||
| Turnout | 2,516 | |||
Chells
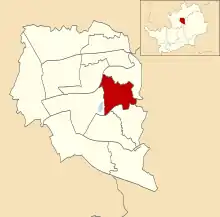
Location of Chells ward
| Party | Candidate | Votes | % | |
|---|---|---|---|---|
| Labour | Pamela Stuart | 1,315 | 52.6 | |
| Liberal Democrats | Mary Griffith | 737 | 29.5 | |
| Conservative | Susan Smith | 450 | 18.0 | |
| Majority | 578 | 23.1 | ||
| Turnout | 2,502 | |||
Longmeadow
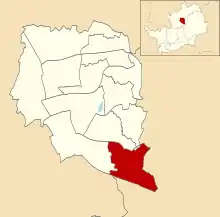
Location of Longmeadow ward
| Party | Candidate | Votes | % | |
|---|---|---|---|---|
| Labour | Suzanne Myson | 1,158 | 49.4 | |
| Conservative | William Clark | 580 | 24.8 | |
| Liberal Democrats | Margaret Latham | 437 | 18.7 | |
| Green | William Hoyes | 167 | 7.1 | |
| Majority | 578 | 24.6 | ||
| Turnout | 2,342 | |||
Manor
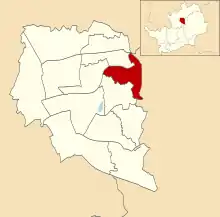
Location of Manor ward
| Party | Candidate | Votes | % | |
|---|---|---|---|---|
| Liberal Democrats | Lis Knight | 1,459 | 54.0 | |
| Labour | Gordana Bjelic-Rados | 700 | 25.9 | |
| Conservative | Prudence Howells | 543 | 20.1 | |
| Majority | 759 | 28.1 | ||
| Turnout | 2,702 | |||
Martins Wood
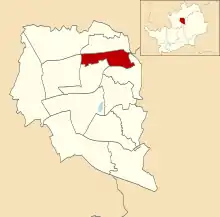
Location of Martins Wood ward
| Party | Candidate | Votes | % | |
|---|---|---|---|---|
| Labour | David Monaghan | 1,166 | 50.6 | |
| Conservative | Matthew Wyatt | 641 | 27.8 | |
| Liberal Democrats | Barbara Segadelli | 338 | 14.7 | |
| Green | Ian Murrill | 161 | 7.0 | |
| Majority | 525 | 22.8 | ||
| Turnout | 2,306 | |||
Old Town
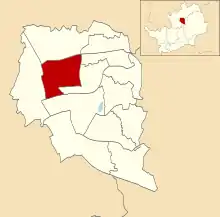
Location of Old Town ward
| Party | Candidate | Votes | % | |
|---|---|---|---|---|
| Labour | Pamela Gallagher | 1,428 | 50.7 | |
| Conservative | Dilys Clark | 815 | 29.0 | |
| Liberal Democrats | Jennifer Moorcroft | 382 | 13.6 | |
| Green | Bernard Chapman | 189 | 6.7 | |
| Majority | 613 | 21.7 | ||
| Turnout | 2,814 | |||
Pin Green
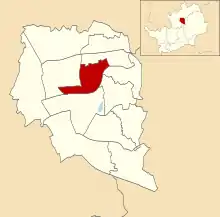
Location of Pin Green ward
| Party | Candidate | Votes | % | |
|---|---|---|---|---|
| Labour | Tanis Kent | 1,369 | 59.3 | |
| Conservative | Leslie Clark | 544 | 23.6 | |
| Liberal Democrats | Audrey Griffith | 395 | 17.1 | |
| Majority | 825 | 35.7 | ||
| Turnout | 2,308 | |||
Roebuck
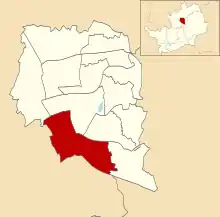
Location of Roebuck ward
| Party | Candidate | Votes | % | |
|---|---|---|---|---|
| Labour | Alfred McCarthy | 1,246 | 53.9 | |
| Conservative | Anita Speight | 597 | 25.8 | |
| Liberal Democrats | Gordon Knight | 467 | 20.2 | |
| Majority | 649 | 28.1 | ||
| Turnout | 2,310 | |||
St Nicholas
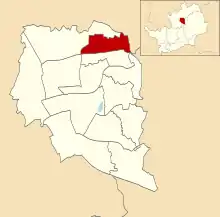
Location of St Nicholas ward
| Party | Candidate | Votes | % | |
|---|---|---|---|---|
| Labour | Carol Latif | 1,167 | 54.3 | |
| Conservative | Matthew Hurst | 494 | 23.0 | |
| Liberal Democrats | Heather Snell | 488 | 22.7 | |
| Majority | 673 | 31.3 | ||
| Turnout | 2,149 | |||
Shephall
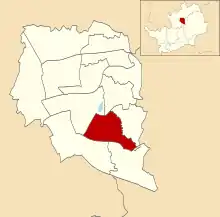
Location of Shephall ward
| Party | Candidate | Votes | % | |
|---|---|---|---|---|
| Labour | Robert Clark | 1,436 | 63.2 | |
| Conservative | Christopher Blanchett | 433 | 19.0 | |
| Liberal Democrats | Nicholas Baskerville | 404 | 17.8 | |
| Majority | 1,003 | 44.2 | ||
| Turnout | 2,273 | |||
Symonds Green
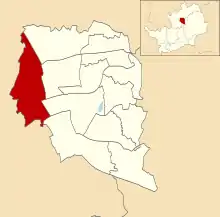
Location of Symonds Green ward
| Party | Candidate | Votes | % | |
|---|---|---|---|---|
| Labour | Sharon Taylor | 1,535 | 64.6 | |
| Conservative | Louisa Notley | 841 | 35.4 | |
| Majority | 694 | 29.2 | ||
| Turnout | 2,376 | |||
Woodfield
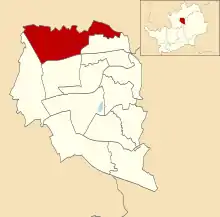
Location of Woodfield ward
| Party | Candidate | Votes | % | |
|---|---|---|---|---|
| Conservative | Marion Mason | 863 | 45.2 | |
| Labour | Ralph Raynor | 744 | 38.9 | |
| Liberal Democrats | John Meacham | 304 | 15.9 | |
| Majority | 119 | 6.3 | ||
| Turnout | 1,911 | |||
References
This article is issued from Wikipedia. The text is licensed under Creative Commons - Attribution - Sharealike. Additional terms may apply for the media files.