2012 Weymouth and Portland Borough Council election
Elections to Weymouth and Portland Borough Council in Dorset took place on Thursday 3 May 2012.[1]
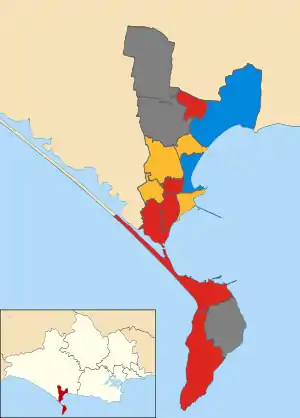
Map of the results of the 2012 Weymouth and Portland council election. Labour in red, Liberal Democrats in yellow and Conservatives in blue. Wards in grey were not contested in 2012.
After the election, the composition of the council was
- Conservative 14
- Labour 11
- Liberal Democrat 8
- Independent 3
Election result
| Party | Seats | Gains | Losses | Net gain/loss | Seats % | Votes % | Votes | +/− | |
|---|---|---|---|---|---|---|---|---|---|
| Labour | 6 | 5 | 0 | +5 | 50.0 | 35.2 | 5,020 | ||
| Liberal Democrats | 4 | 0 | 3 | -3 | 33.3 | 25.9 | 3,683 | ||
| Conservative | 2 | 2 | 3 | -1 | 16.7 | 29.2 | 4,159 | ||
| Green | 0 | 0 | 0 | 0 | 0.0 | 4.7 | 665 | ||
| Independent | 0 | 0 | 1 | -1 | 0.0 | 4.5 | 646 | ||
| United People's Party | 0 | 0 | 0 | 0 | 0.0 | 0.5 | 72 | ||
Gain/loss is relative to the 2008 results.
Ward results
| Party | Candidate | Votes | % | ±% | |
|---|---|---|---|---|---|
| Labour | Rachel Rogers | 500 | 67.66 | ||
| Conservative | John Ellis | 239 | 32.34 | ||
| Majority | 261 | ||||
| Turnout | 746 | 27.13 | |||
| Labour hold | Swing | ||||
| Party | Candidate | Votes | % | ±% | |
|---|---|---|---|---|---|
| Conservative | Peter Farrell | 431 | 33.46 | ||
| Liberal Democrats | Howard Legg | 375 | 29.11 | ||
| Green | Jon Orrell | 243 | 18.87 | ||
| Labour | Stewart Pearson | 239 | 18.56 | ||
| Majority | 56 | ||||
| Turnout | 1,291 | 25.85 | |||
| Conservative gain from Liberal Democrats | Swing | ||||
Farrell had been elected as a Liberal Democrat in 2008.
| Party | Candidate | Votes | % | ±% | |
|---|---|---|---|---|---|
| Conservative | Ian Bruce | 998 | 47.21 | ||
| Liberal Democrats | David Mannings | 841 | 39.78 | ||
| Labour | Joseph Rookes | 275 | 13.01 | ||
| Majority | 157 | ||||
| Turnout | 2,140 | 49.19 | |||
| Conservative gain from Liberal Democrats | Swing | ||||
| Party | Candidate | Votes | % | ±% | |
|---|---|---|---|---|---|
| Liberal Democrats | Ian Roebuck | 554 | 50.87 | ||
| Labour Co-op | Andy Hutchings | 208 | 19.10 | ||
| Conservative | Alison Scott | 180 | 16.53 | ||
| Independent | Graham Winter | 147 | 13.50 | ||
| Majority | 346 | ||||
| Turnout | 1,094 | 35.94 | |||
| Liberal Democrats hold | Swing | ||||
| Party | Candidate | Votes | % | ±% | |
|---|---|---|---|---|---|
| Labour | Ray Nowak | 394 | 36.52 | ||
| Independent | Tim Woodcock | 315 | 29.19 | ||
| Conservative | Richard Paisley | 298 | 27.62 | ||
| United People's Party | Jo Bray | 72 | 6.67 | ||
| Majority | 79 | ||||
| Turnout | 1,085 | 26.49 | |||
| Labour gain from Conservative | Swing | ||||
| Party | Candidate | Votes | % | ±% | |
|---|---|---|---|---|---|
| Labour | Sandy West | 404 | 55.34 | ||
| Independent | Robert Hughes | 184 | 25.21 | ||
| Conservative | Tim Munro | 142 | 19.45 | ||
| Majority | 220 | ||||
| Turnout | 734 | 27.14 | |||
| Labour gain from Independent | Swing | ||||
Munro (incumbent) had been elected as an Independent in 2008.
| Party | Candidate | Votes | % | ±% | |
|---|---|---|---|---|---|
| Labour | Mike Byatt | 307 | 34.23 | ||
| Liberal Democrats | Oz Kanji | 248 | 27.65 | ||
| Conservative | Andrew Manvell | 209 | 23.30 | ||
| Green | Jane Burnet | 133 | 14.83 | ||
| Majority | 59 | ||||
| Turnout | 904 | 31.12 | |||
| Labour gain from Liberal Democrats | Swing | ||||
| Party | Candidate | Votes | % | ±% | |
|---|---|---|---|---|---|
| Liberal Democrats | Ryan Hope | 706 | 47.13 | ||
| Labour | Lindsay Drage | 502 | 33.51 | ||
| Conservative | Jean Woodward | 290 | 19.36 | ||
| Majority | 204 | ||||
| Turnout | 1,512 | 35.02 | |||
| Liberal Democrats hold | Swing | ||||
| Party | Candidate | Votes | % | ±% | |
|---|---|---|---|---|---|
| Liberal Democrats | Gill Taylor | 522 | 54.04 | ||
| Labour | Michael Wheller | 317 | 32.82 | ||
| Conservative | Sonia Cash | 127 | 13.15 | ||
| Majority | 205 | ||||
| Turnout | 1,024 | 32.69 | |||
| Liberal Democrats hold | Swing | ||||
| Party | Candidate | Votes | % | ±% | |
|---|---|---|---|---|---|
| Liberal Democrats | John Birtwhistle | 362 | 36.42 | ||
| Conservative | Geoffery Smith | 322 | 32.39 | ||
| Labour | Michael Frost | 201 | 20.22 | ||
| Green | David Smith | 109 | 10.97 | ||
| Majority | 40 | ||||
| Turnout | 1,007 | 34.77 | |||
| Liberal Democrats hold | Swing | ||||
| Party | Candidate | Votes | % | ±% | |
|---|---|---|---|---|---|
| Labour | Colin Huckle | 656 | 47.13 | ||
| Conservative | Nigel Reed | 481 | 34.55 | ||
| Green | Brian Heatley | 180 | 12.93 | ||
| Liberal Democrats | Richard Shrubb | 75 | 5.39 | ||
| Majority | 175 | ||||
| Turnout | 1,400 | 34.65 | |||
| Labour gain from Conservative | Swing | ||||
| Party | Candidate | Votes | % | ±% | |
|---|---|---|---|---|---|
| Labour | Kate Wheller | 1,017 | 69.71 | ||
| Conservative | John Worth | 442 | 30.29 | ||
| Majority | 575 | ||||
| Turnout | 1,475 | 33.52 | |||
| Labour gain from Conservative | Swing | ||||
References
- "Weymouth and Portland Live Local Election Results - 3rd May 2012". Archived from the original on 6 June 2014. Retrieved 27 July 2012.
| Bournemouth, Christchurch and Poole Council | |
|---|---|
| Dorset Council | |
| Dorset County Council | |
| Bournemouth Borough Council | |
| Christchurch Borough Council | |
| East Dorset District Council | |
| North Dorset District Council |
|
| Poole Borough Council | |
| Purbeck District Council | |
| West Dorset District Council | |
| Weymouth and Portland Borough Council | |
| |
This article is issued from Wikipedia. The text is licensed under Creative Commons - Attribution - Sharealike. Additional terms may apply for the media files.