2013 Bavarian state election
The 2013 Bavarian state election was held on 15 September 2013 to elect the 180 members of the 17th Landtag of Bavaria. It was held one week before the 2013 German federal election. The CSU regained the absolute majority it had lost in 2008, while the Free Democratic Party (FDP), a member of the outgoing governing coalition, fell below the 5% electoral threshold and lost all its seats.[2] Minister-President Horst Seehofer continued in office.
| |||||||||||||||||||||||||||||||||||||||||||||||||||||||||||
All 180 seats in the Landtag of Bavaria 91 seats needed for a majority | |||||||||||||||||||||||||||||||||||||||||||||||||||||||||||
|---|---|---|---|---|---|---|---|---|---|---|---|---|---|---|---|---|---|---|---|---|---|---|---|---|---|---|---|---|---|---|---|---|---|---|---|---|---|---|---|---|---|---|---|---|---|---|---|---|---|---|---|---|---|---|---|---|---|---|---|
| Turnout | 11,812,965 (63.6%)[1] | ||||||||||||||||||||||||||||||||||||||||||||||||||||||||||
| |||||||||||||||||||||||||||||||||||||||||||||||||||||||||||
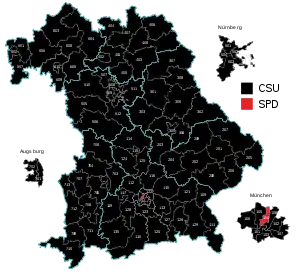 Results for the single-member constituencies in the election. | |||||||||||||||||||||||||||||||||||||||||||||||||||||||||||
| |||||||||||||||||||||||||||||||||||||||||||||||||||||||||||


As of 2020, this is the latest state or federal election in which a party managed to get an absolute majority. The CSU previously held an absolute majority, and therefore governed alone, from 1966 to 2008 and again from 2013 to 2018.
Parties
The table below lists parties represented in the 16th Landtag of Bavaria.
| Name | Ideology | Leader(s) | 2008 result | |||
|---|---|---|---|---|---|---|
| Votes (%) | Seats | |||||
| CSU | Christian Social Union in Bavaria Christlich-Soziale Union in Bayern |
Christian democracy | Horst Seehofer | 43.4% | 92 / 187 | |
| SPD | Social Democratic Party of Germany Sozialdemokratische Partei Deutschlands |
Social democracy | Christian Ude | 18.6% | 39 / 187 | |
| FW | Free Voters of Bavaria Freie Wähler Bayern |
Regionalism | Hubert Aiwanger | 10.2% | 21 / 187 | |
| Grüne | Alliance 90/The Greens Bündnis 90/Die Grünen |
Green politics | Margarete Bause | 9.4% | 19 / 187 | |
| FDP | Free Democratic Party Freie Demokratische Partei |
Classical liberalism | Martin Zeil | 8.0% | 16 / 187 | |
Opinion polling
| Polling firm | Fieldwork date | Sample size |
CSU | SPD | FW | Grüne | FDP | Linke | Piraten | Others | Lead |
|---|---|---|---|---|---|---|---|---|---|---|---|
| 2013 state election | 15 Sep 2013 | – | 47.7 | 20.6 | 9.0 | 8.6 | 3.3 | 2.1 | 2.0 | 6.7 | 27.1 |
| Emnid | 4–5 Sep 2013 | ~1,000 | 47 | 18 | 8 | 12 | 4 | 4 | 3 | 4 | 29 |
| Forschungsgruppe Wahlen | 3–5 Sep 2013 | 1,010 | 48 | 20 | 8 | 10 | 4 | – | – | 10 | 28 |
| Infratest dimap | 3–5 Sep 2013 | 1,006 | 47 | 21 | 7 | 11 | 3 | 3 | – | 8 | 26 |
| GMS | 30 Aug – 2 Sep 2013 | 1,009 | 47 | 18 | 8 | 13 | 5 | 3 | 2 | 4 | 29 |
| Emnid | 23–24 Aug 2013 | 1,000 | 48 | 18 | 8 | 13 | 4 | 3 | 3 | 3 | 30 |
| Infratest dimap | 11–15 Jul 2013 | 1,004 | 47 | 18 | 8 | 15 | 3 | 3 | – | 6 | 29 |
| GMS | 8–10 Jul 2013 | 1,007 | 47 | 19 | 10 | 11 | 5 | 2 | 2 | 4 | 28 |
| Emnid | 4–6 Jul 2013 | 1,000 | 47 | 19 | 9 | 11 | 5 | 3 | 3 | 3[lower-alpha 1] | 28 |
| Forschungsgruppe Wahlen | 10–12 Jun 2013 | 1,009 | 46 | 20 | 10 | 13 | 4 | – | – | 7 | 26 |
| GMS | 3–10 Jun 2013 | 1,309 | 46 | 20 | 9 | 11 | 4 | 3 | 2 | 5 | 26 |
| Forsa | 8–25 May 2013 | 1,102 | 46 | 20 | 9 | 12 | 4 | 3 | 2 | 5 | 26 |
| GMS | 28–30 Apr 2013 | 1,008 | 47 | 20 | 8 | 13 | 3 | 2 | 2 | 5 | 27 |
| INSA | 15–17 Apr 2013 | 1,005 | 49 | 18 | 9 | 16 | 2 | 2 | – | 4 | 31 |
| GMS | 4–15 Feb 2013 | 1,004 | 48 | 21 | 8 | 12 | 3 | 3 | 2 | ? | 27 |
| TNS Infratest | 28 Jan – 6 Feb 2013 | 1,001 | 46 | 19 | 8 | 15 | 3 | 2 | 3 | 4 | 27 |
| Emnid | 5–7 Feb 2013 | 1,001 | 48 | 20 | 9 | 12 | 3 | 2 | 3 | ? | 28 |
| Emnid | ? | ? | 48 | 20 | 8 | 12 | 3 | 3 | 3 | ? | 28 |
| Forsa | 17 Dec 2012–8 Jan 2013 | 1,119 | 46 | 18 | 9 | 13 | 3 | 4 | 2 | 5 | 28 |
| Infratest dimap | 3–7 Jan 2013 | 1,000 | 47 | 19 | 9 | 14 | 3 | 2 | 3 | 3 | 28 |
| GMS | 4–7 Dec 2012 | 1,100 | 49 | 22 | 8 | 10 | 4 | ? | 4 | ? | 27 |
| GMS | 22–30 Oct 2012 | ? | 48 | 20 | 8 | 10 | 5 | 2 | 4 | ? | 28 |
| GMS | 16–18 Oct 2012 | 1,007 | 48 | 20 | 8 | 10 | 5 | 2 | 4 | 3 | 28 |
| Emnid | 26 Sep – 10 Oct 2012 | 1,001 | 48 | 21 | 8 | 10 | 4 | 2 | 4 | 3 | 27 |
| Emnid | ? | ? | 47 | 21 | 9 | 10 | 3 | 2 | 5 | 3 | 26 |
| Emnid | 27–30 Jul 2012 | 1,000 | 46 | 20 | 8 | 12 | 3 | 2 | 6 | 3 | 26 |
| GMS | June 2012 | 1,000 | 46 | 19 | 6/8[lower-alpha 2] | 10 | 4 | ? | 9/7[lower-alpha 3] | ? | 27 |
| Forsa | 21–29 Jun 2012 | 1,150 | 43 | 23 | 9 | 11 | 2 | 2 | 6 | 4 | 20 |
| Emnid | 20–21 Jun 2012 | 1,000 | 44 | 22 | 6 | 13 | 3 | 1 | 7 | 4 | 22 |
| Emnid | 16–18 Apr 2012 | 1,000 | 46 | 20 | 7 | 12 | 2 | 2 | 8 | 3 | 26 |
| Emnid | 15–20 Mar 2012 | 1,001 | 46 | 20 | 8 | 13 | 2 | 2 | 5 | 4 | 26 |
| Infratest dimap | 2–3 Jan 2012 | 1,000 | 44 | 21 | 8 | 14 | 3 | 2 | 4 | 4 | 23 |
| GMS | 30 Dec 2011–3 Jan 2012 | 1,002 | 42 | 22 | 9 | 12 | 2 | 2 | 5 | 6 | 20 |
| Emnid | December 2012 | 1,000 | 44 | 21 | 9 | 13 | 2 | 2 | 5 | ? | 23 |
| Forsa | 26 Oct – 25 Nov 2011 | 1,002 | 41 | 24 | 9 | 10 | 3 | 3 | 6 | 4[lower-alpha 4] | 17 |
| Emnid | September 2011 | ? | 43 | 20 | 9 | 17 | 2 | 3 | – | 6 | 23 |
| Emnid | 31 Aug – 1 Sep 2011 | 1,000 | 44 | 18 | 9 | 18 | 4 | ? | – | ? | 26 |
| Forsa | 15–26 Aug 2011 | 1,007 | 41 | 21 | 10 | 16 | 3 | 4 | – | 5 | 20 |
| GMS | 6–8 Jun 2011 | 1,002 | 42 | 19 | 6 | 18 | 4 | 4 | – | 7 | 23 |
| Emnid | 6–8 Jun 2011 | 1,000 | 45 | 15 | 8 | 20 | 4 | 4 | – | 4 | 25 |
| Emnid | 11–17 Mar 2011 | 1,000 | 46 | 17 | 7 | 17 | 4 | 4 | – | 5 | 29 |
| Forsa | 4–14 Jan 2011 | 1,048 | 40 | 16 | 10 | 20 | 4 | 4 | – | 6 | 20 |
| Infratest dimap | 6–10 Jan 2011 | 1,000 | 46 | 17 | 4 | 17 | 6 | 4 | 1 | 5 | 29 |
| Emnid | 10–12 Dec 2010 | 1,001 | 45 | 18 | 6 | 16 | 5 | 5 | – | 5 | 27 |
| Infratest dimap | 7–12 Jan 2010 | 1,001 | 41 | 17 | 6 | 15 | 11 | 3 | – | 5 | 24 |
| 2009 federal election | 27 Sep 2009 | – | 42.6 | 16.8 | ? | 10.8 | 14.7 | 6.5 | ? | 8.6 | 25.8 |
| Infratest dimap | 8–11 Jan 2009 | 1,000 | 45 | 17 | 10 | 11 | 10 | 3 | – | 4 | 28 |
| GMS | 4–5 Jan 2009 | 1,002 | 45 | 19 | 8 | 10 | 8 | 4 | – | 6 | 26 |
| GMS | 12–17 Dec 2008 | 1,002 | 45 | 19 | 8 | 10 | 8 | 4 | – | 6 | 26 |
| 2008 state election | 28 Sep 2008 | – | 43.4 | 18.6 | 10.2 | 9.4 | 8.0 | 4.3 | – | 6.1[lower-alpha 5] | 24.8 |
Election result
The CSU regained an absolute majority of the seats, which they had lost in the 2008 election after 50 years of single-party government. The FDP, which had governed with the CSU since 2008, fell below the 5% threshold and lost all its seats. SPD, the Greens and Free Voters remained in opposition. A record number of 14.1% of the votes cast went unrepresented in the Landtag because of the 5% threshold.
Summary of the 15 September 2013 election results for the Landtag of Bavaria
| Party | Votes | % | +/- | Seats | +/- | Seats % | |
|---|---|---|---|---|---|---|---|
| Christian Social Union (CSU) | 5,632,272 | 47.7 | 101 | 56.1 | |||
| Social Democratic Party (SPD) | 2,436,515 | 20.6 | 42 | 23.3 | |||
| Free Voters of Bavaria (FW) | 1,062,244 | 9.0 | 19 | 10.6 | |||
| Alliance 90/The Greens (Grüne) | 1,018,652 | 8.6 | 18 | 10.0 | |||
| Free Democratic Party (FDP) | 389,584 | 3.3 | 0 | 0 | |||
| The Left (Linke) | 251,086 | 2.1 | 0 | ±0 | 0 | ||
| Bavaria Party (BP) | 247,282 | 2.1 | 0 | ±0 | 0 | ||
| Ecological Democratic Party (ÖDP) | 239,235 | 2.0 | 0 | ±0 | 0 | ||
| Pirate Party Germany (Piraten) | 234,221 | 2.0 | New | 0 | New | 0 | |
| The Republicans (REP) | 117,633 | 1.0 | 0 | ±0 | 0 | ||
| Party for Franconia | 87,237 | 0.7 | New | 0 | New | 0 | |
| National Democratic Party (NPD) | 74,895 | 0.6 | 0 | ±0 | 0 | ||
| Others | 22,019 | 0.2 | 0 | ±0 | 0 | ||
| Total | 11,812,965 | 100.0 | 180 | ||||
| Voter turnout | 63.6 | ||||||
Notes
References
| Wikimedia Commons has media related to Bavaria state election, 2013. |
- The winners and losers - 7 things you need to know about the Bavaria election. The Local de. (German edition). Published 15 October 2018. Retrieved 1 December 2018.
- http://www.wahlen.bayern.de/landtagswahlen/index.php
| German Confederation |
|
|---|---|
| Independent Kingdom |
|
| German Empire |
|
| Weimar Republic | |
| Allied-occupied Germany | |
| Federal Republic | |
| Local elections |
|
| Referendums |
|
| |