2013 New Zealand census
The 2013 New Zealand census was the thirty-third national census. "The National Census Day" used for the census was on Tuesday, 5 March 2013. The population of New Zealand was counted as 4,242,048, – an increase of 214,101 or 5.3% over the 2006 census.[1]
| Thirty-third Census of New Zealand | ||
|---|---|---|
| ||
| General information | ||
| Country | New Zealand | |
| Results | ||
| Total population | 4,242,048 ( | |
| Most populous | Auckland (1,415,550) | |
| Least populous | West Coast (32,148) | |
The 2013 census forms were the same as the forms developed for the 2011 census which was cancelled due to the February 2011 major earthquake in Christchurch. There were no new topics or questions. New Zealand's next census was conducted in March 2018.
Collection methods
The results from the post-enumeration survey showed that the 2013 census recorded 97.6 percent of the residents in New Zealand on census night. However, the overall response rate was 92.9 percent, with a non-response rate of 7.1 percent made up of the net undercount and people who were counted in the census but had not received a form.[2]
Results
Population and dwellings
Population counts for New Zealand regions.[3][4][5]
Note: All figures are for the census usually resident population count.
| Region | Population | Percentage |
|---|---|---|
| Northland | 151,689 | 3.6% |
| Auckland | 1,415,550 | 33.4% |
| Waikato | 403,638 | 9.5% |
| Bay of Plenty | 267,744 | 6.3% |
| Gisborne | 43,656 | 1.0% |
| Taranaki | 109,608 | 2.6% |
| Manawatū | 222,672 | 5.2% |
| Hawke's Bay | 151,179 | 3.6% |
| Wellington | 471,315 | 11.1% |
| North Island | 3,059,418 | 76.3% |
| Nelson | 46,437 | 1.1% |
| Tasman | 47,154 | 1.1% |
| Marlborough | 43,416 | 1.0% |
| Canterbury | 539,436 | 12.7% |
| West Coast | 32,148 | 0.8% |
| Otago | 202,467 | 4.8% |
| Southland | 93,342 | 2.2% |
| South Island | 1,004,397 | 23.7% |
| Area outside region | 600 | 0.0% |
| 4,242,048 | 100.0% |
Ethnicity
The census usually resident population count of 4,242,048 included 230,649 people without an ethnic response and 4,011,399 people who identified with at least one ethnicity.[6] The figures for the total ethnicity of the population.[7]
| Ethnicity | Responses | Change from 2006 | ||
|---|---|---|---|---|
| Number | % | Number | pp | |
| European | 2,969,391 | 74.02 | | |
| New Zealand European | 2,727,009 | 67.98 | ||
| English | 38,916 | 0.97 | ||
| British nfd | 36,024 | 0.90 | ||
| South African nec | 28,656 | 0.71 | ||
| Dutch | 28,503 | 0.71 | ||
| European nfd | 26,472 | 0.66 | ||
| Australian | 22,467 | 0.56 | ||
| Scottish | 14,412 | 0.36 | ||
| Irish | 14,193 | 0.35 | ||
| German | 12,810 | 0.32 | ||
| American | 12,339 | 0.31 | ||
| Māori | 598,605 | 14.92 | ||
| Pacific peoples | 295,941 | 7.38 | ||
| Samoan | 144,138 | 3.59 | ||
| Cook Islands Maori nfd | 61,077 | 1.52 | ||
| Tongan | 60,333 | 1.50 | ||
| Niuean | 23,883 | 0.60 | ||
| Fijian | 14,445 | 0.36 | ||
| Asian | 471,708 | 11.8 | ||
| Chinese nfd | 163,101 | 4.07 | ||
| Indian nfd | 143,520 | 3.58 | ||
| Filipino | 40,350 | 1.01 | ||
| Korean | 30,171 | 0.8 | ||
| Japanese | 14,118 | 0.35 | ||
| Fijian Indian | 10,929 | 0.27 | ||
| Middle Eastern/Latin American/African | 46,953 | 1.17 | ||
| Other | 67,752 | 1.69 | ||
| New Zealander | 65,973 | 1.64 | ||
| Total population stated | 4,011,399 | - | - | - |
| Not elsewhere included | 230,646 | 5.4 | - | - |
| Totals, New Zealand | 4,242,048 | 100.0% | 214,101 | |
| Source: Statistics NZ.[8][9] Total may exceed 100% due to multiple response. | ||||
Ethnic groups by region
| Region | European | Maori | Pacific | Asian | MELAA[lower-alpha 1] | Other | ||||||
|---|---|---|---|---|---|---|---|---|---|---|---|---|
| Num. | % | Num. | % | Num. | % | Num. | % | Num. | % | Num. | % | |
| Northland | 105,060 | 75.7 | 44,931 | 32.4 | 4,461 | 3.2 | 3,927 | 2.8 | 555 | 0.4 | 2,565 | 1.8 |
| Auckland | 789,306 | 59.3 | 142,767 | 10.7 | 194,958 | 14.6 | 307,233 | 23.1 | 24,945 | 1.9 | 15,639 | 1.2 |
| Waikato | 296,097 | 77.4 | 83,742 | 21.9 | 14,700 | 3.8 | 26,382 | 6.9 | 3,561 | 0.9 | 6,660 | 1.7 |
| Bay of Plenty | 189,597 | 75.7 | 68,940 | 27.5 | 7,728 | 3.1 | 12,963 | 5.2 | 1,266 | 0.5 | 4,407 | 1.8 |
| Gisborne | 24,504 | 60.8 | 19,683 | 48.9 | 1,542 | 3.8 | 975 | 2.4 | 159 | 0.4 | 624 | 1.5 |
| Hawke's Bay | 110,940 | 77.7 | 34,659 | 24.3 | 6,270 | 4.4 | 5,115 | 3.6 | 663 | 0.5 | 2,766 | 1.9 |
| Taranaki | 89,802 | 86.2 | 18,150 | 17.4 | 1,701 | 1.6 | 3,594 | 3.5 | 444 | 0.4 | 2,112 | 2.0 |
| Manawatu-Whanganui | 172,101 | 81.3 | 43,596 | 20.6 | 7,341 | 3.5 | 10,863 | 5.1 | 1,335 | 0.6 | 4,422 | 2.1 |
| Wellington | 345,180 | 77.0 | 58,335 | 13.0 | 36,105 | 8.0 | 47,235 | 10.5 | 6,576 | 1.5 | 8,202 | 1.8 |
| North Island | 2,122,587 | 69.6 | 514,803 | 16.9 | 274,806 | 9.0 | 418,287 | 13.7 | 39,504 | 1.3 | 47,397 | 1.6 |
| Tasman | 42,189 | 93.1 | 3,441 | 7.6 | 480 | 1.1 | 882 | 1.9 | 138 | 0.3 | 1,083 | 2.4 |
| Nelson | 39,720 | 89.3 | 4,167 | 9.4 | 798 | 1.8 | 1,953 | 4.4 | 213 | 0.5 | 945 | 2.1 |
| Marlborough | 37,041 | 89.2 | 4,776 | 11.5 | 969 | 2.3 | 1,182 | 2.8 | 246 | 0.6 | 1,044 | 2.5 |
| West Coast | 27,441 | 91.2 | 3,171 | 10.5 | 315 | 1.0 | 678 | 2.3 | 120 | 0.4 | 837 | 2.8 |
| Canterbury | 448,650 | 86.9 | 41,910 | 8.1 | 12,723 | 2.5 | 35,847 | 6.9 | 4,374 | 0.8 | 10,236 | 2.0 |
| Otago | 171,615 | 89.1 | 14,388 | 7.5 | 3,933 | 2.0 | 10,038 | 5.2 | 2,043 | 1.1 | 4,164 | 2.2 |
| Southland | 79,731 | 89.0 | 11,607 | 13.0 | 1,917 | 2.1 | 2,841 | 3.2 | 315 | 0.4 | 2,031 | 2.3 |
| South Island | 846,387 | 88.2 | 83,460 | 8.7 | 21,135 | 2.2 | 53,421 | 5.6 | 7,449 | 0.8 | 20,340 | 2.1 |
| Source: Statistics New Zealand.[8][9] | ||||||||||||
Birthplace
The number of people living in New Zealand who were born overseas continued to climb. In 2013, 1,001,787 people (25.2 percent) were born overseas. For the overseas-born census "usually resident population":
| Birthplace | Responses | Change from 2006 | ||
|---|---|---|---|---|
| Number | % | Number | pp | |
| New Zealand | 2,980,824 | 74.85 | ||
| Overseas | 1,001,787 | 25.15 | | |
| England | 215,589 | 5.41 | ||
| China, People's Republic of[lower-alpha 2] | 89,121 | 2.24 | ||
| India | 67,176 | 1.69 | ||
| Australia | 62,712 | 1.57 | ||
| South Africa | 54,276 | 1.36 | ||
| Fiji | 52,755 | 1.32 | ||
| Samoa | 50,661 | 1.27 | ||
| Philippines | 37,299 | 0.94 | ||
| Korea, Republic of | 26,601 | 0.67 | ||
| Scotland | 25,953 | 0.65 | ||
| United States | 21,462 | 0.54 | ||
| Netherlands | 19,815 | 0.50 | ||
| Germany | 12,942 | 0.32 | ||
| Japan | 10,269 | 0.26 | ||
| Total people stated | 3,982,611 | 100.00% | - | - |
| Not elsewhere included | 259,437 | – | - | - |
| Total people | 4,242,048 | 100.00% | 214,101 | |
| Source: Statistics New Zealand.[13][10][11][12] | ||||
Religion
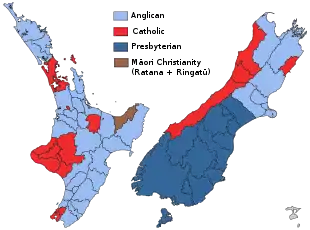
The table below is based on religious affiliation data recorded at the last three censuses for usually resident people. Note that figures and percentages may not add to 100 percent as it is possible for people to state more than one religion.[14]
| Religion | 2013 Census[lower-alpha 3] | |
|---|---|---|
| Number | Percentage | |
| Christian | 1,858,977 | 47.65% |
| Catholic | 492,105 | 12.61% |
| Anglican | 459,771 | 11.79% |
| Presbyterian, Congregational and Reformed | 330,516 | 8.47% |
| Christian (not further defined) | 216,177 | 5.54% |
| Methodist | 102,879 | 2.64% |
| Pentecostal | 74,256 | 1.90% |
| Baptist | 54,345 | 1.39% |
| Latter–day Saints | 40,728 | 1.04% |
| Brethren | 18,624 | 0.48% |
| Jehovah's Witnesses | 17,931 | 0.46% |
| Adventist | 17,085 | 0.44% |
| Evangelical, Born Again and Fundamentalist | 15,381 | 0.39% |
| Orthodox | 13,806 | 0.35% |
| Salvation Army | 9,162 | 0.23% |
| Protestant (not further defined) | 4,998 | 0.13% |
| Lutheran | 3,903 | 0.10% |
| Church of Christ and Associated Churches of Christ | 2,145 | 0.05% |
| Uniting/Union Church and Ecumenical | 999 | 0.03% |
| Asian Christian | 132 | 0.01% |
| Other Christian | 3,714 | 0.10% |
| Hindu | 89,319 | 2.11% |
| Buddhist | 58,404 | 1.50% |
| Māori Christian | 52,947 | 1.36% |
| Rātana | 40,353 | 1.03% |
| Ringatū | 13,272 | 0.34% |
| Māori Christian (not further defined) | 222 | 0.01% |
| Other Māori Christian | 333 | 0.01% |
| Islam/Muslim | 46,149 | 1.18% |
| Spiritualism and New Age Religions | 18,285 | 0.47% |
| Spiritualist | 7,776 | 0.20% |
| Nature and Earth Based Religions | 5,943 | 0.15% |
| Satanism | 840 | 0.02% |
| New Age (not further defined) | 441 | 0.01% |
| Church of Scientology | 318 | 0.01% |
| Other New Age Religions | 3,015 | 0.08% |
| Judaism/Jewish | 6,867 | 0.18% |
| Other Religions | 34,245 | 0.88% |
| Sikh | 19,191 | 0.49% |
| Other Religion (not further defined) | 5,202 | 0.13% |
| Baháʼí | 2,634 | 0.07% |
| Māori Religion | 2,595 | 0.07% |
| Theism | 1,782 | 0.05% |
| Zoroastrian | 972 | 0.02% |
| Chinese Religions | 906 | 0.02% |
| Japanese Religions | 423 | 0.01% |
| Jainism | 207 | 0.01% |
| Other Other Religions | 333 | 0.01% |
| Total people with at least one religious affiliation | 2,146,167 | 55.01% |
| No Religion | 1,635,345 | 41.92% |
| Object to answering | 173,034 | 4.44% |
| Total people stated | 3,901,167 | 100.00% |
| Not elsewhere included[lower-alpha 4] | 347,301 | - |
| 4,242,048 | – | |
Notes
- Middle Eastern, Latin American and African
- Does not include Hong Kong SAR and Macau SAR.
- The 2011 Census was cancelled due to the 2011 Christchurch earthquake; the 2013 census replaced it.
- Includes don't know, religion unidentifiable, response outside scope (e.g., Jedi Knight or Pastafarian), and not stated.
References
- 2013 Census Usually Resident Population Counts Key facts – Statistics New Zealand
- 2013 Census counted 97.6% percent of population - Statistics New Zealand
- 2013 Census tables about a place 2013 Census tables about a place give you an overview of New Zealand's communities. Get information on topics such as age and sex, cultural diversity, qualifications, income, and housing.
- 2013 Census QuickStats about national highlights Archived 23 July 2016 at the Wayback Machine Population and dwellings
- 2013 Census Usually Resident Population Counts Population counts for New Zealand cities.
- More information about ethnic populations, multiple ethnicity, birthplace and birthplace. Archived 12 February 2016 at the Wayback Machine 2013 Census
- Statistics New Zealand. "2013 Census QuickStats About Māori". Retrieved 20 December 2013.
- "2013 Census – Major ethnic groups in New Zealand". stats.govt.nz. 29 January 2015. Retrieved 11 January 2016.
- Quickstats about Māori population Statistics New Zealand
- 2013 Census QuickStats about culture and identity Birthplace and people born overseas.
- Birthplace of people in New Zealand Archived 25 March 2016 at the Wayback Machine 2013 Census
- Birthplace (detailed)(1) For the census usually resident population count 2001, 2006, and 2013 Censuses Table 11
- "2013 Census totals by topic". Statistics New Zealand. Archived from the original on 13 December 2013. Retrieved 17 March 2014.
- "2013 Census QuickStats about culture and identity – tables". Statistics New Zealand. 15 April 2014. Archived from the original on 24 May 2014. Retrieved 18 July 2015.