2017 Surrey County Council election
The 2017 Surrey County Council election took place as part of the 2017 local elections in the UK.[1] All 81 councillors were elected for single-member electoral divisions for a four-year term. The electoral system used is first-past-the-post voting.
| |||||||||||||||||||||||||||||||||||||||||||||||||||||
All 81 seats to Surrey County Council 41 seats needed for a majority | |||||||||||||||||||||||||||||||||||||||||||||||||||||
|---|---|---|---|---|---|---|---|---|---|---|---|---|---|---|---|---|---|---|---|---|---|---|---|---|---|---|---|---|---|---|---|---|---|---|---|---|---|---|---|---|---|---|---|---|---|---|---|---|---|---|---|---|---|
| |||||||||||||||||||||||||||||||||||||||||||||||||||||
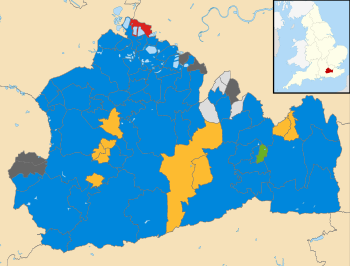 Map showing the results of the election in each division | |||||||||||||||||||||||||||||||||||||||||||||||||||||

The result was Conservative councillors formed an increased majority on the council at the equivalent loss of three seats formerly won by UKIP. Two tied second-largest party groupings of councillors were unaltered as to their seats, on net balance. These were Liberal Democrats and an informal alliance of Independent and Residents Association councillors: nine councillors each. The balance of two councillors continued as one Labour Party and one Green Party of England and Wales member.
Results summary
| Party | Seats | Gains | Losses | Net gain/loss | Seats % | Votes % | Votes | +/− | |
|---|---|---|---|---|---|---|---|---|---|
| Conservative | 61 | +3 | 48.7 | 148,534 | |||||
| Liberal Democrats | 9 | 0 | 23.0 | 70,139 | |||||
| Independents and Residents' Associations | 9 | 0 | 9.7 | 29,446 | |||||
| Labour | 1 | 0 | 9.5 | 29,047 | |||||
| Green | 1 | 0 | 4.2 | 12,795 | |||||
| UKIP | 0 | -3 | 4.9 | 14,935 | |||||
Division Results
An asterisk * indicates an incumbent seeking re-election.
Addlestone
| Party | Candidate | Votes | % | ±% | |
|---|---|---|---|---|---|
| Conservative | John Furey* | 1,804 | 54 | +14.4 | |
| Labour | June Tilbury | 648 | 19 | -1.4 | |
| UKIP | Nicolas Wood | 356 | 11 | -20.9 | |
| Liberal Democrats | Chelsea Whyte | 324 | 10 | +4 | |
| Green | Richard Miller | 232 | 7 | n/a | |
| Majority | 1156 | 35 | +27.3 | ||
| Turnout | 3364 | 31 | +6 | ||
| Conservative hold | Swing | ||||
Ash
| Party | Candidate | Votes | % | ±% | |
|---|---|---|---|---|---|
| Conservative | Marsha Moseley* | 1,675 | 60 | +13 | |
| Liberal Democrats | Caroline Johnson | 528 | 19 | -1 | |
| Labour | Jacob Armani | 249 | 9 | -3 | |
| UKIP | Kyle Greaves | 192 | 7 | -14 | |
| Green | Neil Jameson | 152 | 5 | n/a | |
| Majority | 1147 | 41 | +15 | ||
| Turnout | 2796 | 28 | 0 | ||
| Conservative hold | Swing | ||||
Ashford
| Party | Candidate | Votes | % | ±% | |
|---|---|---|---|---|---|
| Conservative | Naz Islam | 1,725 | 47 | +3 | |
| UKIP | Paul West | 591 | 16 | -17 | |
| Labour | Rebecca Geach | 564 | 15 | -2 | |
| Independent | Frank Ayres | 357 | 10 | n/a | |
| Liberal Democrats | Thomas Fidler | 271 | 7 | +2 | |
| Green | Rupert Jackson | 177 | 5 | n/a | |
| Majority | 1134 | 31 | +20 | ||
| Turnout | 3685 | 34 | +6.57 | ||
| Conservative hold | Swing | ||||
Ashtead
| Party | Candidate | Votes | % | ±% | |
|---|---|---|---|---|---|
| Independent | Christopher Townsend* | 2,763 | 54 | +1 | |
| Conservative | Chris Hunt | 1777 | 35 | +4 | |
| Liberal Democrats | Sebastian Bate | 225 | 4 | +2 | |
| Labour | Susan Gilchrist | 194 | 4 | 0 | |
| Green | Tony Cooper | 123 | 2 | n/a | |
| Majority | 986 | 19 | -3 | ||
| Turnout | 5082 | 45 | +6.49 | ||
| Independent hold | Swing | ||||
At the previous election the UKIP candidate polled 11%
Bagshot, Windlesham and Chobham
| Party | Candidate | Votes | % | ±% | |
|---|---|---|---|---|---|
| Conservative | Mike Goodman* | 2,437 | 62 | +8 | |
| Liberal Democrats | Sam Kay | 679 | 17 | +6 | |
| Green | Andrew Willgoss | 579 | 15 | n/a | |
| Labour | Paul Edwards | 219 | 6 | -8 | |
| Majority | 1758 | 45 | +13 | ||
| Turnout | 3914 | 36 | +8 | ||
| Conservative hold | Swing | ||||
In the previous election the UKIP candidate polled 22%.
Banstead, Woodmansterne & Chipstead
| Party | Candidate | Votes | % | ±% | |
|---|---|---|---|---|---|
| Conservative | Ken Gulati* | 2,414 | 67 | +17 | |
| Liberal Democrats | James Fowler | 529 | 15 | +7 | |
| Labour | Evan Gregory | 276 | 8 | n/a | |
| UKIP | Gillian Grant | 238 | 7 | -26 | |
| Green | Phil Wilson | 165 | 5 | -4 | |
| Majority | 1885 | 52 | +35.2 | ||
| Turnout | 3622 | 33 | +7 | ||
| Conservative hold | Swing | ||||
Bookham and Fetcham West
| Party | Candidate | Votes | % | ±% | |
|---|---|---|---|---|---|
| Conservative | Clare Curran* | 3,256 | 51 | +6 | |
| Liberal Democrats | Raj Haque | 2604 | 41 | +15 | |
| Green | Damian McDevitt | 288 | 4 | n/a | |
| UKIP | Marjorie Dixon | 253 | 4 | -19 | |
| Majority | 652 | 10 | -10 | ||
| Turnout | 6401 | 54 | +15 | ||
| Conservative hold | Swing | ||||
Camberley East
| Party | Candidate | Votes | % | ±% | |
|---|---|---|---|---|---|
| Conservative | Bill Chapman* | 2,233 | 71 | +19 | |
| Liberal Democrats | David Whitcroft | 511 | 16 | n/a | |
| Labour | Bernard Collins | 402 | 13 | -5 | |
| Majority | 1722 | 56 | +34 | ||
| Turnout | 3146 | 29 | +6 | ||
| Conservative hold | Swing | ||||
At the previous election the UKIP candidate polled 30%.
Camberley West
| Party | Candidate | Votes | % | ±% | |
|---|---|---|---|---|---|
| Conservative | Charlotte Morley | 1,839 | 51 | +6 | |
| Labour | Richard Claridge | 621 | 17 | -14 | |
| Independent | David Allen | 394 | 11 | n/a | |
| Liberal Democrats | Morgan Rise | 328 | 9 | n/a | |
| Independent | Frances Halstead | 300 | 8 | n/a | |
| UKIP | Damian Heads | 151 | 4 | -20 | |
| Majority | 1218 | 34 | +20 | ||
| Turnout | 3633 | 31 | +3 | ||
| Conservative hold | Swing | ||||
Caterham Hill
| Party | Candidate | Votes | % | ±% | |
|---|---|---|---|---|---|
| Liberal Democrats | Chris Botten | 1,738 | 44 | -2 | |
| Conservative | Rod Stead | 1726 | 44 | +15 | |
| Labour | Eddington Pindura | 262 | 7 | +1 | |
| UKIP | Joe Branco | 197 | 5 | -15 | |
| Majority | 12 | 0 | -17.5 | ||
| Turnout | 3923 | 36 | +3 | ||
| Liberal Democrats hold | Swing | ||||
Caterham Valley
| Party | Candidate | Votes | % | ±% | |
|---|---|---|---|---|---|
| Liberal Democrats | David Lee | 1,589 | 47 | +21 | |
| Conservative | Michael Cooper | 1343 | 40 | =0.5 | |
| Labour | Mark Wood | 242 | 7 | -1 | |
| UKIP | Jeffrey Bolter | 172 | 5 | -16 | |
| Majority | 246 | 7 | |||
| Turnout | 3346 | 36 | +6 | ||
| Liberal Democrats gain from Conservative | Swing | ||||
In the previous election a Green Party candidate polled 5%.
Chertsey
| Party | Candidate | Votes | % | ±% | |
|---|---|---|---|---|---|
| Conservative | Mark Nuti | 1,978 | 59 | +17 | |
| Labour | Arran Neathey | 650 | 19 | -7.7 | |
| Liberal Democrats | Sylvia Whyte | 381 | 11 | n/a | |
| UKIP | Bill Bruno | 326 | 10 | -21.4 | |
| Majority | 1328 | 40 | +29.5 | ||
| Turnout | 3335 | 31 | +3 | ||
| Conservative hold | Swing | ||||
Cobham
| Party | Candidate | Votes | % | ±% | |
|---|---|---|---|---|---|
| Conservative | Mary Lewis* | 2,290 | 67 | +10 | |
| Liberal Democrats | David Bellchamber | 679 | 20 | +9 | |
| Labour | Lana Hylands | 254 | 7 | 0 | |
| UKIP | Elaine Kingston | 175 | 5 | -19 | |
| Majority | 1611 | 47 | +14 | ||
| Turnout | 3398 | 33 | +7.15 | ||
| Conservative hold | Swing | ||||
Cranleigh & Ewhurst
| Party | Candidate | Votes | % | ±% | |
|---|---|---|---|---|---|
| Conservative | Andrew Povey | 2,094 | 54 | +3 | |
| Liberal Democrats | Richard Cole | 1098 | 28 | +14 | |
| UKIP | Roseleen Egan | 362 | 9 | -17 | |
| Labour | Luke Wenman | 334 | 9 | 0 | |
| Majority | 996 | 26 | +1 | ||
| Turnout | 3888 | 37 | +4 | ||
| Conservative hold | Swing | ||||
Dorking Hills
| Party | Candidate | Votes | % | ±% | |
|---|---|---|---|---|---|
| Liberal Democrats | Hazel Watson* | 2,906 | 57 | +11 | |
| Conservative | David Mir | 1675 | 33 | +6 | |
| Green | Jacquetta Fewster | 231 | 4 | -1 | |
| UKIP | David Payne | 167 | 3 | -16 | |
| Labour | Emma Davies | 155 | 3 | 0 | |
| Majority | 1231 | 24 | +5 | ||
| Turnout | 5134 | 48 | +7 | ||
| Liberal Democrats hold | Swing | ||||
Dorking Rural
| Party | Candidate | Votes | % | ±% | |
|---|---|---|---|---|---|
| Conservative | Helyn Clack* | 2,580 | 54 | +14 | |
| Liberal Democrats | Roger Abbott | 1695 | 35 | +1 | |
| UKIP | Geoff Cox | 248 | 5 | -16 | |
| Green | Jeff Zie | 164 | 3 | n/a | |
| Labour | Angus Rendall | 125 | 3 | -3 | |
| Majority | 885 | 19 | +13 | ||
| Turnout | 4812 | 44 | +3 | ||
| Conservative hold | Swing | ||||
Dorking South and the Holmwoods
| Party | Candidate | Votes | % | ±% | |
|---|---|---|---|---|---|
| Liberal Democrats | Stephen Cooksey* | 2,261 | 51 | +9 | |
| Conservative | Roger Jones | 1466 | 33 | +6 | |
| Green | Chris Crook | 256 | 6 | n/a | |
| UKIP | Michael Foulston | 205 | 5 | -16 | |
| Labour | Peter Horitz | 204 | 5 | -4 | |
| Majority | 795 | 18 | +3 | ||
| Turnout | 4392 | 42 | +4 | ||
| Liberal Democrats hold | Swing | ||||
Earlswood and Reigate South
| Party | Candidate | Votes | % | ±% | |
|---|---|---|---|---|---|
| Conservative | Barbara Thomas* | 1,621 | 48 | +15 | |
| Labour | Graham Wildridge | 633 | 19 | -2 | |
| Liberal Democrats | Moray Carey | 488 | 14 | +7 | |
| UKIP | Brian Stiff | 353 | 10 | -21 | |
| Green | Sue Fenton | 235 | 9 | +1 | |
| Majority | 988 | 29 | +27 | ||
| Turnout | 3330 | 33 | +4.59 | ||
| Conservative hold | Swing | ||||
East Molesey and Esher
| Party | Candidate | Votes | % | ±% | |
|---|---|---|---|---|---|
| Conservative | Peter Szanto | 2,095 | 54 | +13 | |
| Residents | Elizabeth Cooper | 1149 | 30 | -11 | |
| Liberal Democrats | Paul Nagle | 318 | 8 | +6 | |
| Labour | Raymond Kelly | 159 | 4 | ||
| Green | Laura Harmour | 102 | 3 | n/a | |
| UKIP | Trevor Marshall | 66 | 2 | -9 | |
| Majority | 946 | 24 | +24 | ||
| Turnout | 3889 | 40 | +11.39 | ||
| Conservative gain from Residents | Swing | 12 | |||
Egham
| Party | Candidate | Votes | % | ±% | |
|---|---|---|---|---|---|
| Conservative | Yvonna Lay* | 1,104 | 49 | +6.5 | |
| Labour | Fiona Dent | 464 | 21 | +1 | |
| Liberal Democrats | Jake Short | 299 | 13 | +3 | |
| UKIP | David Roe | 224 | 10 | -18 | |
| Green | Fergus Munro | 147 | 7 | n/a | |
| Majority | 640 | 28 | +13.5 | ||
| Turnout | 2238 | 28 | +7 | ||
| Conservative hold | Swing | ||||
Englefield Green
| Party | Candidate | Votes | % | ±% | |
|---|---|---|---|---|---|
| Conservative | Marisa Heath* | 1,169 | 41 | -2 | |
| Runnymeade Independent Residents Group | Chris Fisher | 809 | 29 | n/a | |
| Labour | Ben Tozer | 307 | 11 | -5 | |
| Liberal Democrats | Will Coles | 255 | 9 | +2 | |
| UKIP | David Hunt | 148 | 5 | -19 | |
| Green | Lee-Anne Lawrence | 138 | 5 | -5 | |
| Majority | 360 | 12 | -7.4 | ||
| Turnout | 2826 | 29 | +9.5 | ||
| Conservative hold | Swing | ||||
Epsom Town & Downs
| Party | Candidate | Votes | % | ±% | |
|---|---|---|---|---|---|
| Conservative | Tina Mountain* | 1,751 | 42 | +3 | |
| Residents | Clive Woodbridge | 1321 | 32 | +4 | |
| Liberal Democrats | Julie Anne Morris | 612 | 15 | +4 | |
| Labour | Veronica Monks | 347 | 8 | ||
| Green | Theresa MacIntyre | 138 | 3 | n/a | |
| Majority | 430 | 10 | -1 | ||
| Turnout | 4169 | 37 | +4 | ||
| Conservative hold | Swing | ||||
At the last election the UKIP candidate polled 13%.
Epsom West
| Party | Candidate | Votes | % | ±% | |
|---|---|---|---|---|---|
| Conservative | Bernie Muir | 1,218 | 30 | +17 | |
| Liberal Democrats | Clare Clark | 1144 | 28 | 0 | |
| Labour | Kate Chinn | 839 | 21 | +1 | |
| Residents | Barry Nash | 717 | 18 | -5 | |
| Green | Janice Baker | 165 | 4 | n/a | |
| Majority | 74 | 2 | |||
| Turnout | 4083 | 37 | +8 | ||
| Conservative gain from Liberal Democrats | Swing | ||||
At the last election the UKIP candidate polled 16%
Ewell
| Party | Candidate | Votes | % | ±% | |
|---|---|---|---|---|---|
| Residents | John Beckett* | 2,579 | 66 | +3 | |
| Conservative | James Tarbit | 732 | 19 | +8 | |
| Labour | Rosalind Godson | 255 | 7 | +2 | |
| Liberal Democrats | Alison Kelly | 234 | 6 | +3 | |
| Green | Susan McGrath | 79 | 2 | n/a | |
| Majority | 1847 | 47 | 0 | ||
| Turnout | 3879 | 33 | +6 | ||
| Residents hold | Swing | ||||
In the previous election the UKIP candidate polled 16%
Ewell Court, Auriol & Cuddington
| Party | Candidate | Votes | % | ±% | |
|---|---|---|---|---|---|
| Residents | Eber Kington* | 2,708 | 68 | +4 | |
| Conservative | Karan Persand | 776 | 19 | +10 | |
| Labour | Erica Gregory | 254 | 6 | 0 | |
| Liberal Democrats | Paul Coulter | 180 | 4 | +1 | |
| Green | Lucy Barford | 92 | 2 | n/a | |
| Majority | 1932 | 49 | +3 | ||
| Turnout | 4010 | 34 | +6 | ||
| Residents hold | Swing | ||||
In the last election the UKIP candidate polled 18%.
Farnham Central
| Party | Candidate | Votes | % | ±% | |
|---|---|---|---|---|---|
| Farnham Residents | Andy MacLeod | 1754 | 43 | n/a | |
| Liberal Democrats | Jo Aylwin | 1085 | 27 | +9 | |
| Conservative | Pat Frost* | 1,057 | 26 | -7 | |
| Green | Fiona Scimone | 164 | 4 | n/a | |
| Majority | 669 | 16 | n/a | ||
| Turnout | 4060 | 41 | +11 | ||
| Farnham Residents gain from Conservative | Swing | ||||
At the past election the UKIP candidate polled 22%, the Independent candidate polled 18% and the Labour candidate polled 8%.
Farnham North
| Party | Candidate | Votes | % | ±% | |
|---|---|---|---|---|---|
| Farnham Residents | Stephen Spence | 1606 | 45 | n/a | |
| Conservative | Mike Hodge | 1274 | 36 | +4 | |
| Liberal Democrats | Rob Walton | 437 | 12 | +1 | |
| Green | Dave Beynon | 230 | 6 | n/a | |
| Majority | 332 | 9 | n/a | ||
| Turnout | 3547 | 36 | +5 | ||
| Farnham Residents gain from Conservative | Swing | ||||
In the previous election the UKIP candidate polled 31%, an Independent candidate polled 18% and Labour polled 7%.
Farnham South
| Party | Candidate | Votes | % | ±% | |
|---|---|---|---|---|---|
| Conservative | Robert Ramsdale | 1526 | 39 | -11 | |
| Farnham Residents | John Ward | 1463 | 37 | n/a | |
| Liberal Democrats | Mark Turner | 550 | 14 | +4 | |
| Labour | Andrew Jones | 148 | 4 | -3 | |
| Independent | Mark Westcott | 140 | 4 | n/a | |
| UKIP | Jim Burroughs | 86 | 2 | -14 | |
| Majority | 63 | 2 | n/a | ||
| Turnout | 3913 | 40 | +6 | ||
| Conservative hold | Swing | ||||
Foxhills, Thorpe and Virginia Water
| Party | Candidate | Votes | % | ±% | |
|---|---|---|---|---|---|
| Conservative | Mel Few* | 2,314 | 65 | +12 | |
| Liberal Democrats | Don Whyte | 462 | 13 | +7 | |
| Labour | Jacqueline Fletcher | 333 | 9 | -3.4 | |
| UKIP | Steve Gynn | 321 | 9 | -19.6 | |
| Green | Tobias Horkan | 116 | 3 | n/a | |
| Majority | 1852 | 52 | +27.6 | ||
| Turnout | 2314 | 34 | +7 | ||
| Conservative hold | Swing | ||||
Frimley Green and Mytchett
| Party | Candidate | Votes | % | ±% | |
|---|---|---|---|---|---|
| Conservative | Paul Deach | 2,103 | 61 | +25 | |
| Liberal Democrats | Cindy Ferguson | 672 | 19 | +1 | |
| Labour | Jenniann Davies | 267 | 8 | -4 | |
| UKIP | Paul Chapman | 252 | 7 | -26 | |
| Green | Peter Barnett | 129 | 4 | n/a | |
| Christian Party | Juliana Brimicombe | 52 | 1 | n/a | |
| Majority | 1431 | 42 | +39 | ||
| Turnout | 3475 | 33 | +8 | ||
| Conservative hold | Swing | ||||
Godalming North
| Party | Candidate | Votes | % | ±% | |
|---|---|---|---|---|---|
| Liberal Democrats | Penny Rivers | 1,895 | 46 | +25 | |
| Conservative | Steve Cosser* | 1656 | 40 | -4 | |
| Green | James Coope | 349 | 8 | n/a | |
| UKIP | Brian Egan | 254 | 6 | -13 | |
| Majority | 239 | 6 | |||
| Turnout | 4154 | 37 | +6 | ||
| Liberal Democrats gain from Conservative | Swing | ||||
In the previous election the Labour candidate polled 16%.
Godalming South, Milford & Witley
| Party | Candidate | Votes | % | ±% | |
|---|---|---|---|---|---|
| Conservative | Peter Martin | 2,484 | 62 | +5 | |
| Liberal Democrats | Paul Follows | 952 | 24 | +12 | |
| Labour | Kate Townsend | 542 | 14 | +5 | |
| Majority | 1532 | 38 | +3 | ||
| Turnout | 3978 | 37 | +4 | ||
| Conservative hold | Swing | ||||
In the previous election the UKIP candidate polled 22%.
Godstone
| Party | Candidate | Votes | % | ±% | |
|---|---|---|---|---|---|
| Conservative | Rose Thorn | 1,646 | 47 | +8.5 | |
| UKIP | Helena Windsor* | 949 | 27 | -12.9 | |
| Liberal Democrats | Tamzie Hollands | 613 | 18 | +6.2 | |
| Labour | Linda Baharier | 290 | 8 | 0 | |
| Majority | 697 | 20 | +18.6 | ||
| Turnout | 3498 | 37 | +4 | ||
| Conservative gain from UKIP | Swing | ||||
Goldsworth East and Horsell Village
| Party | Candidate | Votes | % | ±% | |
|---|---|---|---|---|---|
| Conservative | Colin Kemp* | 1,934 | 43 | +7 | |
| Liberal Democrats | John Doran | 1876 | 42 | +8 | |
| Labour | John Scott-Morgan | 463 | 10 | -2 | |
| UKIP | Tim Read | 241 | 5 | -13 | |
| Majority | 58 | 1 | -1 | ||
| Turnout | 4514 | 41 | +8 | ||
| Conservative hold | Swing | ||||
Guildford East
| Party | Candidate | Votes | % | ±% | |
|---|---|---|---|---|---|
| Conservative | Graham Ellwood* | 1,910 | 45 | -5 | |
| Liberal Democrats | George Potter | 1495 | 35 | +10 | |
| Labour | Richard Mithen | 505 | 12 | +2 | |
| Green | Sam Peters | 304 | 7 | n/a | |
| Majority | 415 | 10 | -15 | ||
| Turnout | 4214 | 41 | +5 | ||
| Conservative hold | Swing | ||||
At the last election the UKIP candidate polled 15%.
Guildford North
| Party | Candidate | Votes | % | ±% | |
|---|---|---|---|---|---|
| Liberal Democrats | Angela Goodwin | 1,564 | 42 | +7 | |
| Conservative | David Snipp | 1250 | 33 | +9 | |
| Labour | Anne Rouse | 724 | 19 | -1 | |
| Green | Paul Stevenson | 206 | 6 | n/a | |
| Majority | 314 | 9 | -2 | ||
| Turnout | 3744 | 34 | +7 | ||
| Liberal Democrats hold | Swing | ||||
At the last election the UKIP candidate polled 21%.
Guildford South-East
| Party | Candidate | Votes | % | ±% | |
|---|---|---|---|---|---|
| Conservative | Mark Brett-Warburton* | 2,073 | 51 | -2 | |
| Liberal Democrats | Leonie Anderson | 1641 | 40 | +14 | |
| Labour | Howard Smith | 355 | 9 | 0 | |
| Majority | 432 | 11 | -16 | ||
| Turnout | 4069 | 40 | +7 | ||
| Conservative hold | Swing | ||||
At the last election the UKIP candidate polled 12%.
Guildford South-West
| Party | Candidate | Votes | % | ±% | |
|---|---|---|---|---|---|
| Liberal Democrats | David Goodwin* | 1,975 | 51 | +13 | |
| Conservative | Bob Hughes | 1128 | 31 | -2 | |
| Labour | Matthew Smith | 330 | 9 | -4 | |
| Green | Mark Bray-Parry | 208 | 6 | n/a | |
| Peace | Chapel Kabir | 34 | 1 | -3 | |
| Majority | 847 | 20 | +15 | ||
| Turnout | 3675 | 37 | +8 | ||
| Liberal Democrats hold | Swing | ||||
At the last election the UKIP candidate polled 13%.
Guildford West
| Party | Candidate | Votes | % | ±% | |
|---|---|---|---|---|---|
| Liberal Democrats | Fiona White* | 955 | 43 | +8 | |
| Labour Co-op | George Dokimakis | 573 | 26 | +2 | |
| Conservative | Adrian Chandler | 567 | 26 | +10 | |
| Green | Jo Purvis | 71 | 3 | n/a | |
| Peace | John Morris | 38 | 2 | -3 | |
| Socialist (GB) | Adam Buick | 12 | 1 | n/a | |
| Majority | 382 | 17 | +6 | ||
| Turnout | 2216 | 29 | +9 | ||
| Liberal Democrats hold | Swing | ||||
At the last election the UKIP candidate polled 21%.
Haslemere
| Party | Candidate | Votes | % | ±% | |
|---|---|---|---|---|---|
| Conservative | Richard Hampson | 1,849 | 53 | +18 | |
| Liberal Democrats | John Robini | 990 | 28 | +20 | |
| Green | Jon Taylor | 304 | 9 | n/a | |
| Labour | Kim Hemmingway | 200 | 6 | +1 | |
| UKIP | Gail Weingartner | 164 | 5 | -12 | |
| Majority | 859 | 25 | +25 | ||
| Turnout | 3507 | 37 | +2 | ||
| Conservative gain from Independent | Swing | ||||
At the last election the Independent candidate polled 35%.
Heatherside and Parkside
| Party | Candidate | Votes | % | ±% | |
|---|---|---|---|---|---|
| Conservative | Edward Hawkins | 2,041 | 54 | +2 | |
| Liberal Democrats | John Skipper | 638 | 17 | +2 | |
| Independent | David Ivison* | 466 | 12 | n/a | |
| Labour | Jill Coles | 216 | 6 | -2 | |
| UKIP | Hazel Prowse | 179 | 5 | -20 | |
| Green | Yvonne Greenwood | 153 | 4 | n/a | |
| Independent | Barrie Cullen | 75 | 2 | n/a | |
| Majority | 1403 | 37 | +10 | ||
| Turnout | 3768 | 36 | +10 | ||
| Conservative gain from Independent | Swing | ||||
In the 2013 election David Ivison won the seat for the Conservatives
Hersham
| Party | Candidate | Votes | % | ±% | |
|---|---|---|---|---|---|
| Conservative | John O'Reilly | 2,146 | 54 | +14 | |
| Hersham Village Society | Roy Green | 981 | 25 | -10 | |
| Labour | Peter Ramsbottom | 296 | 8 | +1 | |
| Liberal Democrats | Michael Smith | 287 | 7 | +3 | |
| Green | Olivia Palmer | 230 | 6 | n/a | |
| Majority | 1165 | 29 | +24 | ||
| Turnout | 3940 | 38 | +5.2 | ||
| Conservative hold | Swing | ||||
In the previous election a UKIP candidate polled 14%
Hinchley Wood, Claygate & Oxshott
| Party | Candidate | Votes | % | ±% | |
|---|---|---|---|---|---|
| Conservative | Mike Bennison* | 2,395 | 50 | ||
| Liberal Democrats | Alastair Coomes | 2,269 | 47 | +17 | |
| UKIP | Bernard Collignon | 157 | 3 | -12 | |
| Majority | 126 | 3 | -17 | ||
| Turnout | 4,821 | 40 | +7.52 | ||
| Conservative hold | Swing | ||||
Horley East
| Party | Candidate | Votes | % | ±% | |
|---|---|---|---|---|---|
| Conservative | Graham Knight | 1,990 | 60 | +13 | |
| Labour | Linda Mabbett | 494 | 15 | +4 | |
| UKIP | Malcolm Brighting | 386 | 12 | -19 | |
| Liberal Democrats | Judith Sykes | 298 | 9 | 0 | |
| Green | David Scoffield | 172 | 5 | n/a | |
| Majority | 1496 | 45 | +29 | ||
| Turnout | 3340 | 32 | +7.52 | ||
| Conservative hold | Swing | ||||
Horley West, Salfords and Sidlow
| Party | Candidate | Votes | % | ±% | |
|---|---|---|---|---|---|
| Conservative | Kay Hammond* | 1,697 | 55 | +13 | |
| Labour | Tom Turner | 434 | 14 | 0 | |
| UKIP | Joseph Fox | 429 | 14 | -22 | |
| Liberal Democrats | Geoffrey Southall | 215 | 12 | +3 | |
| Green | Muriel Passmore | 155 | 5 | n/a | |
| Majority | 1263 | 41 | +35 | ||
| Turnout | 2930 | 32 | +6.28 | ||
| Conservative hold | Swing | ||||
Horsleys
| Party | Candidate | Votes | % | ±% | |
|---|---|---|---|---|---|
| Conservative | Julie Iles | 2,450 | 54 | -6 | |
| Liberal Democrats | Paul Kennedy | 1731 | 38 | +26 | |
| Green | Ann James | 134 | 3 | n/a | |
| UKIP | Robert Cane | 108 | 2 | -19 | |
| Labour | Carolyn Fiddes | 108 | 2 | -5 | |
| Majority | 719 | 16 | -23 | ||
| Turnout | 4531 | 46 | +10 | ||
| Conservative hold | Swing | ||||
Knaphill and Goldsworth West
| Party | Candidate | Votes | % | ±% | |
|---|---|---|---|---|---|
| Conservative | Saj Hussain* | 2,342 | 63 | +14 | |
| Liberal Democrats | Ann-Marie Barker | 804 | 22 | +2 | |
| Labour | Peter Ford | 356 | 10 | +3 | |
| UKIP | Troy De Leon | 203 | 5 | -10 | |
| Majority | 1538 | 41 | +12 | ||
| Turnout | 3705 | 34 | +1 | ||
| Conservative hold | Swing | ||||
At the preceding election, an Independent candidate polled 10%.
Laleham and Shepperton
| Party | Candidate | Votes | % | ±% | |
|---|---|---|---|---|---|
| Conservative | Richard Walsh* | 2,171 | 54 | +1 | |
| Independent | Stuart Boyle | 665 | 17 | n/a | |
| Labour | Jon Button | 396 | 10 | -2 | |
| Liberal Democrats | Richard Dunn | 349 | 9 | +1 | |
| UKIP | Brian Catt | 271 | 7 | -21 | |
| Green | Peter Hughes | 155 | 4 | n/a | |
| Majority | 1506 | 37 | +12 | ||
| Turnout | 4007 | 39 | +8 | ||
| Conservative hold | Swing | ||||
Leatherhead and Fetcham East
| Party | Candidate | Votes | % | ±% | |
|---|---|---|---|---|---|
| Conservative | Tim Hall* | 2,295 | 53 | +11 | |
| Liberal Democrats | Clare Malcolmson | 1259 | 29 | +8 | |
| Labour | Marc Green | 354 | 8 | 0 | |
| UKIP | Michael Heelas | 251 | 6 | -22 | |
| Green | Julian Everett | 148 | 3 | n/a | |
| Majority | 1036 | 24 | +10 | ||
| Turnout | 4307 | 37 | +5.5 | ||
| Conservative hold | Swing | ||||
Lightwater, West End and Bisley
| Party | Candidate | Votes | % | ±% | |
|---|---|---|---|---|---|
| Conservative | David Mansfield | 2,109 | 55 | +3 | |
| Independent | Graham Alleway | 627 | 16 | n/a | |
| Liberal Democrats | Rob Beere | 613 | 16 | +7 | |
| Labour | Mick Sheehan | 223 | 6 | -5 | |
| Green | Sharon Galliford | 139 | 4 | n/a | |
| UKIP | Piotr Farbiszewski | 128 | 3 | -25 | |
| Majority | 1482 | 39 | +25 | ||
| Turnout | 3839 | 33 | +7 | ||
| Conservative hold | Swing | ||||
Lingfield
| Party | Candidate | Votes | % | ±% | |
|---|---|---|---|---|---|
| Conservative | Lesley Steeds | 2,853 | 69 | +13.8 | |
| Liberal Democrats | Dave Wilkes | 635 | 15 | n/a | |
| UKIP | Richard Grant | 378 | 9 | -16 | |
| Labour | Elizabeth Warwick-Ching | 286 | 7 | 0 | |
| Majority | 2218 | 54 | +28.8 | ||
| Turnout | 4152 | 34 | +1 | ||
| Conservative hold | Swing | ||||
At the previous election the Independent candidate polled 30%.
Lower Sunbury & Halliford
| Party | Candidate | Votes | % | ±% | |
|---|---|---|---|---|---|
| Conservative | Tim Evans* | 1,945 | 51 | +14 | |
| Liberal Democrats | Sandra Dunn | 1211 | 32 | -2 | |
| Labour | Sean Beatty | 319 | 8 | n/a | |
| UKIP | Redvers Cunningham | 223 | 6 | -23 | |
| Green | Steve Trafford | 102 | 3 | n/a | |
| Majority | 734 | 19 | +16 | ||
| Turnout | 3800 | 36 | +7 | ||
| Conservative hold | Swing | ||||
Merstham and Banstead South
| Party | Candidate | Votes | % | ±% | |
|---|---|---|---|---|---|
| Conservative | Bob Gardner* | 1,647 | 55 | +11 | |
| Labour | Stewart Dack | 489 | 16 | -2 | |
| Liberal Democrats | Christopher Howell | 416 | 16 | +5 | |
| UKIP | Leigh Jones | 275 | 9 | -19 | |
| Green | Kumari Lane | 185 | 6 | n/a | |
| Majority | 1158 | 39 | +23 | ||
| Turnout | 3012 | 30 | +4.67 | ||
| Conservative hold | Swing | ||||
Nork and Tattenhams
| Party | Candidate | Votes | % | ±% | |
|---|---|---|---|---|---|
| Residents | Nick Harrison* | 2,470 | 64 | +10 | |
| Conservative | Alex Clarke | 971 | 25 | +9 | |
| Liberal Democrats | Stephen Gee | 184 | 5 | +2 | |
| Labour | Kimberley Griffin | 166 | 4 | +1 | |
| Green | Alistair Morten | 78 | 2 | ||
| Majority | 1499 | 39 | +3 | ||
| Turnout | 3869 | 32 | +4 | ||
| Residents' Association hold | Swing | ||||
At the previous election the UKIP candidate polled 18%.
Oxted
| Party | Candidate | Votes | % | ±% | |
|---|---|---|---|---|---|
| Conservative | Cameron McIntosh | 2,457 | 50 | +5.4 | |
| Liberal Democrats | Craig Shepherd | 878 | 18 | +9 | |
| Labour | Katherine Saunders | 698 | 14 | +2.7 | |
| UKIP | Christopher Dean | 478 | 10 | -19.3 | |
| Green | Benedict Southworth | 362 | 7 | +1 | |
| Majority | 1579 | 32 | +16.7 | ||
| Turnout | 4873 | 41 | +5 | ||
| Conservative hold | Swing | ||||
Redhill East
| Party | Candidate | Votes | % | ±% | |
|---|---|---|---|---|---|
| Green | Jonathan Essex | 1,849 | 53 | +3 | |
| Conservative | Frank Kelly | 879 | 25 | +3 | |
| Labour | Toby Brampton | 350 | 10 | -2 | |
| Liberal Democrats | Stuart Holmes | 250 | 7 | +3 | |
| UKIP | Laurence Clack | 134 | 4 | -9 | |
| Majority | 970 | 28 | 0 | ||
| Turnout | 3462 | 34 | +5 | ||
| Green hold | Swing | ||||
Redhill West and Meadvale
| Party | Candidate | Votes | % | ±% | |
|---|---|---|---|---|---|
| Conservative | Natalie Bramhall* | 1,661 | 43 | +13 | |
| Green | Rob Jarrett | 862 | 22 | +1 | |
| Liberal Democrats | Peter Lambell | 769 | 20 | +2 | |
| Labour | David Heydon | 425 | 11 | 0 | |
| UKIP | Tim Pearson | 158 | 4 | -15 | |
| Majority | 799 | 21 | +12 | ||
| Turnout | 3875 | 38 | +5.77 | ||
| Conservative hold | Swing | ||||
Reigate
| Party | Candidate | Votes | % | ±% | |
|---|---|---|---|---|---|
| Conservative | Zully Grant-Duff* | 2,157 | 52 | +3 | |
| Liberal Democrats | John Vincent | 1263 | 31 | +13 | |
| Green | Liz Wakefield | 283 | 7 | -1 | |
| Labour | Robin Spencer | 257 | 6 | -3 | |
| UKIP | Phyll Cambridge | 149 | 4 | =12 | |
| Majority | 894 | 21 | -10 | ||
| Turnout | 4109 | 39 | +8 | ||
| Conservative hold | Swing | ||||
Shalford
| Party | Candidate | Votes | % | ±% | |
|---|---|---|---|---|---|
| Conservative | Matt Furniss | 2,036 | 55 | n/a | |
| Liberal Democrats | James Steel | 480 | 13 | -24 | |
| Guildford Greenbelt Group | Nick Norton | 401 | 11 | n/a | |
| UKIP | George Johnson* | 312 | 8 | -43 | |
| Labour | Mark Redhead | 241 | 7 | -2 | |
| Green | Fran Aslin | 208 | 6 | n/a | |
| Majority | 1556 | 42 | +28 | ||
| Turnout | 3678 | 35 | +8 | ||
| Conservative gain from UKIP | Swing | ||||
Shere
| Party | Candidate | Votes | % | ±% | |
|---|---|---|---|---|---|
| Conservative | Keith Taylor* | 2,207 | 62 | +5 | |
| Liberal Democrats | Tom Hunt | 713 | 20 | +9 | |
| Green | Vicki Elcoate | 391 | 11 | n/a | |
| Labour | Robin Woof | 256 | 7 | -2 | |
| Majority | 1494 | 42 | +8 | ||
| Turnout | 3567 | 37 | +3 | ||
| Conservative hold | Swing | ||||
At the previous election the UKIP candidate polled 23%.
Staines
| Party | Candidate | Votes | % | ±% | |
|---|---|---|---|---|---|
| Conservative | Sinead Mooney | 1,455 | 41 | -6 | |
| UKIP | Denise Saliagopoulos* | 718 | 20 | -2 | |
| Labour | John Johnston | 589 | 16 | +3 | |
| Liberal Democrats | Nichola Cornes | 571 | 16 | +7 | |
| Green | Elizabeth Mansfield | 208 | 6 | -2 | |
| TUSC | Matt Clarke | 46 | 1 | n/a | |
| Majority | 737 | 21 | -4 | ||
| Turnout | 3587 | 34 | +8 | ||
| Conservative hold | Swing | ||||
Staines South & Ashford West
| Party | Candidate | Votes | % | ±% | |
|---|---|---|---|---|---|
| Conservative | Denise Turner-Stewart* | 1,914 | 53 | +15 | |
| Labour | Suzanne Gulbrandson | 589 | 16 | -4 | |
| UKIP | Chris Beresford | 530 | 15 | -23 | |
| Liberal Democrats | Christopher Bateson | 448 | 12 | +8 | |
| Green | Anoma Jacobs | 118 | 3 | n/a | |
| Majority | 1325 | 37 | 37 | ||
| Turnout | 3599 | 33 | +5 | ||
| Conservative hold | Swing | ||||
Stanwell & Stanwell Moor
| Party | Candidate | Votes | % | ±% | |
|---|---|---|---|---|---|
| Labour | Robert Evans * | 1,294 | 46 | +11 | |
| Conservative | John Boughtflower | 1080 | 38 | +13 | |
| UKIP | Gerald Gravett | 318 | 11 | -13 | |
| Liberal Democrats | Terrence Lewis | 114 | 4 | -1 | |
| Majority | 214 | 8 | -2 | ||
| Turnout | 2806 | 26 | +2 | ||
| Labour hold | Swing | ||||
At the preceding election an Independent candidate polled 11%.
Sunbury Common & Ashford Common
| Party | Candidate | Votes | % | ±% | |
|---|---|---|---|---|---|
| Conservative | Alison Griffiths | 1,406 | 44 | +23 | |
| Liberal Democrats | Ian Beardsmore* | 1041 | 33 | -7 | |
| Labour | Susan Bryer | 402 | 13 | -1 | |
| UKIP | Peter Appleford | 266 | 8 | -17 | |
| Green | Paul Jacobs | 80 | 3 | n/a | |
| Majority | 356 | 11 | -4 | ||
| Turnout | 3195 | 28 | +6 | ||
| Conservative gain from Liberal Democrats | Swing | ||||
Tadworth, Walton and Kingswood
| Party | Candidate | Votes | % | ±% | |
|---|---|---|---|---|---|
| Conservative | Jeffrey Harris | 2,596 | 71 | +18 | |
| Liberal Democrats | Stephen Kulka | 313 | 9 | +2 | |
| UKIP | Valerie Moore | 285 | 8 | -24 | |
| Labour | David Burnley | 260 | 7 | n/a | |
| Green | Roger Ponsford | 202 | 6 | -2 | |
| Majority | 2283 | 62 | +41 | ||
| Turnout | 3656 | 33 | +6.27 | ||
| Conservative hold | Swing | ||||
The Byfleets
| Party | Candidate | Votes | % | ±% | |
|---|---|---|---|---|---|
| Conservative | Richard Wilson* | 1,536 | 41 | -9 | |
| Independent | John Edwin Bond | 1203 | 32 | n/a | |
| Liberal Democrats | Anne Roberts | 650 | 18 | 0 | |
| Labour | Alex Wilks | 198 | 5 | -3 | |
| UKIP | Lyn Sage | 122 | 3 | -17 | |
| Majority | 333 | 9 | -21 | ||
| Turnout | 3709 | 37 | +7 | ||
| Conservative hold | Swing | ||||
The Dittons
| Party | Candidate | Votes | % | ±% | |
|---|---|---|---|---|---|
| Residents | Nick Darby | 2,515 | 57 | +2 | |
| Conservative | Bruce Finch | 1001 | 23 | +5 | |
| Liberal Democrats | Gerard Doherty | 724 | 16 | +10 | |
| Labour | Rosemary Rendall | 201 | 5 | -1 | |
| Majority | 1514 | 34 | -3 | ||
| Turnout | 4441 | 38 | +8.99 | ||
| Residents hold | Swing | ||||
In the previous election a UKIP candidate polled 14%
Walton
| Party | Candidate | Votes | % | ±% | |
|---|---|---|---|---|---|
| Conservative | Rachael Lake* | 1,813 | 53 | +16 | |
| Liberal Democrats | Chris Elmer | 753 | 22 | +19 | |
| Labour | Richard Leonard | 620 | 18 | +7 | |
| UKIP | David Ions | 257 | 7 | -9 | |
| Majority | 1060 | 31 | +26 | ||
| Turnout | 3443 | 30 | +4.75 | ||
| Conservative hold | Swing | ||||
In the previous election a Walton Society candidate polled 32%
Walton South & Oatlands
| Party | Candidate | Votes | % | ±% | |
|---|---|---|---|---|---|
| Conservative | Tony Samuels* | 2,351 | 62 | +5 | |
| Liberal Democrats | Adriana Dredge | 862 | 23 | +12 | |
| Labour | Warren Weertman | 378 | 10 | -2 | |
| UKIP | Simon Kadwill-Kelly | 194 | 5 | -15 | |
| Majority | 1489 | 39 | +2 | ||
| Turnout | 3785 | 34 | +7.01 | ||
| Conservative hold | Swing | ||||
Warlingham
| Party | Candidate | Votes | % | ±% | |
|---|---|---|---|---|---|
| Conservative | David Hodge* | 2,265 | 56 | +13.6 | |
| Liberal Democrats | Charles Lister | 1165 | 29 | +7.2 | |
| UKIP | Roger Bird | 403 | 10 | -21.5 | |
| Labour | Jenifer Dugdale | 146 | 5 | +1 | |
| Majority | 1100 | 27 | +16 | ||
| Turnout | 3979 | 40 | +6 | ||
| Conservative hold | Swing | ||||
Waverley Eastern Villages
| Party | Candidate | Votes | % | ±% | |
|---|---|---|---|---|---|
| Conservative | Victoria Young* | 2,519 | 68 | +9 | |
| Liberal Democrats | Fabian Cole | 755 | 20 | +9 | |
| Labour | Lewis Curtis | 246 | 7 | -2 | |
| UKIP | Woodruff Walker | 177 | 5 | -17 | |
| Majority | 1764 | 48 | +11 | ||
| Turnout | 3697 | 37 | +5 | ||
| Conservative hold | Swing | ||||
Waverley Western Villages
| Party | Candidate | Votes | % | ±% | |
|---|---|---|---|---|---|
| Conservative | David Harmer* | 2,345 | 71 | +10 | |
| Liberal Democrats | Geoffrey Whitby | 585 | 18 | +8 | |
| Green | Susan Ryland | 361 | 11 | n/a | |
| Majority | 1760 | 53 | +14 | ||
| Turnout | 3291 | 35 | +3 | ||
| Conservative hold | Swing | ||||
In the previous election the UKIP candidate polled 22% and the Labour candidate polled 7%.
West Ewell
| Party | Candidate | Votes | % | ±% | |
|---|---|---|---|---|---|
| Residents | Jan Mason* | 1,592 | 51 | +2 | |
| Conservative | Stephen Pontin | 729 | 23 | +8 | |
| Labour | Rob Geleit | 462 | 15 | +2 | |
| Liberal Democrats | Julia Kirkland | 270 | 9 | +4 | |
| Green | David Kidd | 97 | 3 | n/a | |
| Majority | 863 | 28 | -3 | ||
| Turnout | 3150 | 27 | +3 | ||
| Residents hold | Swing | ||||
At the last election the UKIP candidate polled 18%.
West Molesey
| Party | Candidate | Votes | % | ±% | |
|---|---|---|---|---|---|
| Residents | Ernest Mallett* | 1,763 | 49 | -22 | |
| Conservative | Steve Bax | 1201 | 34 | +24 | |
| Labour | Jamal Ajjane | 264 | 7 | +5 | |
| Liberal Democrats | Alastair Sturgis | 194 | 5 | +2 | |
| Green | Sarah Spencer-Bowdage | 142 | 4 | n/a | |
| Majority | 562 | 15 | -43 | ||
| Turnout | 3564 | 35 | +7.84 | ||
| Residents hold | Swing | ||||
In the previous election the UKIP candidate polled 13%
Weybridge
| Party | Candidate | Votes | % | ±% | |
|---|---|---|---|---|---|
| Conservative | Tim Oliver | 2,069 | 50 | +18 | |
| Liberal Democrats | Vicki Macleod | 1492 | 36 | +15 | |
| Labour | Stephanie Franklin | 222 | 5 | ||
| UKIP | Timothy Pope | 180 | 4 | +13 | |
| Green | Lesley Tilling | 156 | 4 | n/a | |
| Majority | 577 | 14 | +7 | ||
| Turnout | 4119 | 36 | +8.05 | ||
| Conservative hold | Swing | ||||
Woking North
| Party | Candidate | Votes | % | ±% | |
|---|---|---|---|---|---|
| Conservative | Ben Carasco* | 1,913 | 44 | +8 | |
| Labour | Mohammad Khan | 1666 | 39 | +7 | |
| Liberal Democrats | Henry Kay | 535 | 12 | -5 | |
| UKIP | Judith Squire | 193 | 4 | -10 | |
| Majority | 247 | 5 | +1 | ||
| Turnout | 4307 | 41 | +4 | ||
| Conservative hold | Swing | ||||
Woking South
| Party | Candidate | Votes | % | ±% | |
|---|---|---|---|---|---|
| Liberal Democrats | Will Forster* | 2,271 | 54 | +11 | |
| Conservative | Paul Saper | 1423 | 34 | +5 | |
| Labour | Christopher Martin | 343 | 8 | 0 | |
| UKIP | Richard Squire | 193 | 5 | -12 | |
| Majority | 848 | 20 | +6 | ||
| Turnout | 4230 | 38 | +7 | ||
| Liberal Democrats hold | Swing | ||||
Woking South East
| Party | Candidate | Votes | % | ±% | |
|---|---|---|---|---|---|
| Conservative | Liz Bowes* | 2,341 | 62 | +4 | |
| Liberal Democrats | Liam Lyons | 954 | 25 | +12 | |
| Labour | Geoff O'Shea | 299 | 8 | -2 | |
| UKIP | Robin Milner | 174 | 5 | -14 | |
| Majority | 1387 | 37 | -2 | ||
| Turnout | 3768 | 38 | +6.5 | ||
| Conservative hold | Swing | ||||
Woking South West
| Party | Candidate | Votes | % | ±% | |
|---|---|---|---|---|---|
| Conservative | Ayesha Azad | 1,873 | 55 | +7 | |
| Liberal Democrats | Chris Took | 940 | 28 | +8 | |
| Labour | William James Sellers | 391 | 11 | 0 | |
| UKIP | Terry Knight | 200 | 6 | -15 | |
| Majority | 933 | 27 | 0 | ||
| Turnout | 3404 | 36 | +7 | ||
| Conservative hold | Swing | ||||
Woodham and New Haw
| Party | Candidate | Votes | % | ±% | |
|---|---|---|---|---|---|
| Conservative | Mary Angell* | 2,015 | 63 | +15.7 | |
| Liberal Democrats | Jennifer Coulon | 372 | 12 | +3 | |
| Labour | Philip Martin | 330 | 10 | -3 | |
| UKIP | Valerie Woodhouse | 288 | 9 | -21.9 | |
| Green | Martin Robson | 193 | 6 | n/a | |
| Majority | 1643 | 51 | +35 | ||
| Turnout | 3198 | 32 | +4 | ||
| Conservative hold | Swing | ||||
Worplesdon
| Party | Candidate | Votes | % | ±% | |
|---|---|---|---|---|---|
| Conservative | Keith Witham* | 2,691 | 69 | +18 | |
| Liberal Democrats | Paul Hienkens | 658 | 17 | 0 | |
| Labour | Dominic Stone | 359 | 9 | 0 | |
| Green | Eugene Suggett | 182 | 5 | n/a | |
| Majority | 2033 | 52 | +23 | ||
| Turnout | 3890 | 36 | +4 | ||
| Conservative hold | Swing | ||||
At the previous election the UKIP candidate polled 22%.
References
- "Upcoming elections & referendums". Electoral Commission. Retrieved 15 September 2016.
- "Surrey County Council election results 2017". Surrey County Council. 2017-05-05. Retrieved 2017-05-08.
- Election of Councillors for the Electoral Divisions of Surrey County Council Summary of Results: Thursday 2 May 2013 (PDF)