2019 Carlow County Council election
A Carlow County Council election was held in County Carlow in Ireland on 24 May 2019 as part of that year's local elections. All 18 councillors were elected for a five-year term of office from three local electoral areas (LEAs) by single transferable vote.
| |||||||||||||||||||||||||||||||||||||
All 18 seats to Carlow County Council 10 seats needed for a majority | |||||||||||||||||||||||||||||||||||||
|---|---|---|---|---|---|---|---|---|---|---|---|---|---|---|---|---|---|---|---|---|---|---|---|---|---|---|---|---|---|---|---|---|---|---|---|---|---|
| |||||||||||||||||||||||||||||||||||||
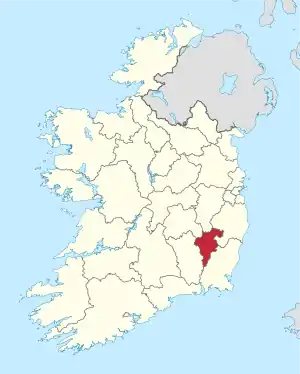 Map showing the area of Carlow County Council | |||||||||||||||||||||||||||||||||||||
| |||||||||||||||||||||||||||||||||||||
The 2018 boundary review committee recommended significant changes to the LEAs used in the 2014 elections due to terms of references requiring a maximum of seven councillors in each LEA and changes in population revealed in the 2016 census.[1] These changes were made by the Minister of State with special responsibility for Local Government and Electoral Reform John Paul Phelan.[2]
Fianna Fáil gained an additional seat to emerge level with Fine Gael on 6 seats apiece and a higher share of the vote. Sinn Féin had a poor election losing two seats, and Cllr John Cassin was re-elected as an Independent. Labour retained two seats, while Adrienne Wallace, who contested Ireland South for Solidarity–People Before Profit in the European Parliament election held on the same day, gained a seat for the party.
Results by party
| Party | Seats | ± | First Pref. votes | FPv% | ±% | |
|---|---|---|---|---|---|---|
| Fianna Fáil | 6 | 7,244 | 33.55% | |||
| Fine Gael | 6 | 6,769 | 31.35% | |||
| Labour | 2 | 1,910 | 8.85% | |||
| Sinn Féin | 1 | 1,817 | 8.41% | |||
| People Before Profit | 1 | 448 | 2.07% | |||
| Aontú | 0 | 310 | 1.44% | |||
| Renua | 0 | 288 | 1.33% | |||
| Independent | 2 | 2,807 | 13.00% | |||
| Totals | 18 | 21,593 | 100% | |||
Results by LEA
Carlow
| Party | Candidate | FPv% | Count | |||||||||
|---|---|---|---|---|---|---|---|---|---|---|---|---|
| 1 | 2 | 3 | 4 | 5 | 6 | 7 | 8 | 9 | ||||
| Fianna Fáil | Fintan Phelan[lower-alpha 1] | 23.26% | 1,711 | |||||||||
| Fianna Fáil | Andrea Dalton[lower-alpha 2] | 14.76% | 1,086 | |||||||||
| Fine Gael | Fergal Browne[lower-alpha 1] | 12.10% | 890 | 1,052 | ||||||||
| Fianna Fáil | Ken Murnane[lower-alpha 2] | 10.78% | 793 | 994 | ||||||||
| Fine Gael | Tom O'Neill | 7.33% | 539 | 627 | 664 | 693 | 721 | 734 | 747 | 785 | 830 | |
| Independent | John Cassin[lower-alpha 1] | 7.16% | 527 | 600 | 630 | 644 | 671 | 688 | 761 | 829 | 902 | |
| People Before Profit | Adrienne Wallace | 6.09% | 448 | 522 | 549 | 586 | 599 | 617 | 701 | 763 | 814 | |
| Fine Gael | Wayne Fennell | 5.87% | 432 | 508 | 541 | 558 | 604 | 613 | 630 | 686 | 745 | |
| Aontú | Mary Hande | 4.21% | 310 | 345 | 360 | 367 | 377 | 385 | 406 | 422 | ||
| Sinn Féin | Ciarán Dooley | 3.28% | 241 | 261 | 267 | 271 | 283 | 288 | ||||
| Independent | Bernard Jennings | 3.18% | 234 | 270 | 280 | 293 | 303 | 307 | 326 | |||
| Labour | Kevin Byrne | 1.97% | 145 | 171 | 179 | 186 | ||||||
| Electorate: 16,425 Valid: 7,356 Spoilt: 121 Quota: 920 Turnout: 7,477 (45.52%) | ||||||||||||
Muinebeag
| Party | Candidate | FPv% | Count | |||||
|---|---|---|---|---|---|---|---|---|
| 1 | 2 | 3 | 4 | 5 | ||||
| Fine Gael | Tommy Kinsella[lower-alpha 1] | 23.06% | 1,617 | |||||
| Labour | Willie Quinn[lower-alpha 1] | 14.02% | 983 | 1,147 | 1,271 | |||
| Sinn Féin | Andy Gladney[lower-alpha 1] | 14.48% | 1,015 | 1,054 | 1,147 | 1,175 | ||
| Fine Gael | Michael Doran[lower-alpha 1] | 12.32% | 864 | 916 | 944 | 951 | 1,185 | |
| Fianna Fáil | Arthur McDonald[lower-alpha 1] | 12.17% | 853 | 893 | 967 | 981 | 1,153 | |
| Fianna Fáil | Josie Daly | 9.63% | 675 | 698 | 798 | 812 | 910 | |
| Fine Gael | Denis Foley[lower-alpha 1] | 7.17% | 503 | 595 | 626 | 634 | ||
| Independent | David O'Brien | 3.58% | 251 | 264 | ||||
| Fianna Fáil | Philip Gahan | 3.57% | 250 | 275 | ||||
| Electorate: 13,175 Valid: 7,011 Spoilt: 133 Quota: 1,169 Turnout: 7,144 (54.22%) | ||||||||
Tullow
| Party | Candidate | FPv% | Count | ||||||||
|---|---|---|---|---|---|---|---|---|---|---|---|
| 1 | 2 | 3 | 4 | 5 | 6 | 7 | 8 | ||||
| Fianna Fáil | John Pender[lower-alpha 1] | 20.01% | 1,446 | ||||||||
| Independent | Charlie Murphy[lower-alpha 1] | 19.32% | 1,396 | ||||||||
| Fine Gael | Brian O'Donoghue[lower-alpha 1] | 11.87% | 858 | 927 | 942 | 955 | 1,050 | ||||
| Labour | William Paton[lower-alpha 1] | 10.82% | 782 | 878 | 904 | 933 | 1,046 | ||||
| Fine Gael | John Murphy[lower-alpha 1] | 9.65% | 697 | 740 | 839 | 891 | 1,006 | 1,018 | 1,163 | ||
| Fianna Fáil | John McDonald | 5.95% | 430 | 547 | 610 | 628 | 657 | 660 | 782 | 833 | |
| Sinn Féin | Jim Deane[lower-alpha 1] | 7.76% | 561 | 588 | 610 | 639 | 673 | 674 | 783 | 795 | |
| Independent | Billy Nolan | 5.52% | 399 | 417 | 500 | 573 | 596 | 597 | |||
| Fine Gael | Maria Ansbro | 5.11% | 369 | 400 | 414 | 457 | |||||
| Renua | Helena Byrne | 3.99% | 288 | 300 | 341 | ||||||
| Electorate: 14,840 Valid: 7,226 Spoilt: 86 Quota: 1,033 Turnout: 7,312 (49.27%) | |||||||||||
Footnotes
- Outgoing councillor elected in 2014.
- Outgoing councillor coopted subsequent to the 2014 election.
References
Sources
- "Local Elections 2019: Results, Transfer of Votes and Statistics" (PDF). Department of Housing, Planning and Local Government. p. 66. Retrieved 10 June 2020.
- "Carlow County Council – Local Election candidates". RTÉ. 13 May 2019. Retrieved 15 May 2019.
- "State of the Poll". Carlow County Council. 25 May 2019. Retrieved 19 June 2019.
Citations
- Local Electoral Area Boundary Committee No. 1 (13 June 2018). "Report 2018" (PDF). Government Publications. pp. 20–23, 141. ISBN 978-1-4064-2990-9. Retrieved 8 May 2019.
- Phelan, John Paul (19 December 2018). "County of Carlow Local Electoral Areas Order 2018". electronic Irish Statute Book (eISB). Retrieved 8 May 2019.