Abbotsford (electoral district)
Abbotsford is a federal electoral district in British Columbia, Canada, that has been represented in the House of Commons of Canada since 2004.
 Abbotsford federal electoral district | |||
| Federal electoral district | |||
| Legislature | House of Commons | ||
| MP |
Conservative | ||
| District created | 2003 | ||
| First contested | 2004 | ||
| Last contested | 2019 | ||
| District webpage | profile, map | ||
| Demographics | |||
| Population (2016)[1][2] | 101,814 | ||
| Electors (2019) | 74,814 | ||
| Area (km²)[1] | 176 | ||
| Pop. density (per km²) | 578.5 | ||
| Census division(s) | Fraser Valley | ||
| Census subdivision(s) | Abbotsford, Fraser Valley H Electoral Area, Matsqui Main 2, Upper Sumas 6 | ||
Demographics
| Ethnic groups in Abbotsford (2016) Source: | Population | % | |
|---|---|---|---|
| Ethnic group | European | 67,010 | 67.4% |
| South Asian | 17,005 | 17.1% | |
| Aboriginal | 6,160 | 6.2% | |
| Chinese | 1,775 | 1.8% | |
| Korean | 1,195 | 1.2% | |
| Filipino | 1,215 | 1.2% | |
| Black | 1,135 | 1.1% | |
| Southeast Asian | 955 | 1% | |
| Latin American | 910 | 0.9% | |
| Japanese | 365 | 0.4% | |
| Arab | 325 | 0.3% | |
| West Asian | 155 | 0.2% | |
| Multiple minorities | 575 | 0.6% | |
| Visible minority, n.i.e. | 145 | 0.1% | |
| Total population | 101,814 | 100% | |
The riding has the lowest proportion of Catholics in Canada, with just 10.6% of the population adhering to Catholicism.,[3] as well as the highest proportion (9.8%) of "Christian, not included elsewhere" (non-Protestant, non-Catholic, non-Orthodox).[4][5] 12.2% of its population claim Dutch ethnic origin, the highest such figure for any Canadian federal riding.[6]
Geography
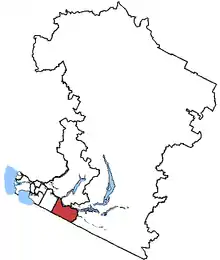
As of the 2012 federal electoral boundaries redistribution, the district includes the southeastern portion of the City of Abbotsford and the Upper Sumas 6 Indian reserve.[7]
History
The electoral district was created in 2003. 56.1% of the riding was taken from Fraser Valley riding, and 43.9% from Langley—Abbotsford.
The 2012 federal electoral boundaries redistribution concluded that the electoral boundaries of Abbotsford should be adjusted, and a modified electoral district of the same name will be contested in future elections.[8] The redefined Abbotsford loses portions of its current territory in the north and west to the new districts of Mission—Matsqui—Fraser Canyon and Langley—Aldergrove. These new boundaries were legally defined in the 2013 representation order, which came into effect upon the call of the 42nd Canadian federal election, scheduled for October 2015.[9]
The 2015 Canadian general election marked the first time a Conservative candidate was elected in Abbotsford with less than 50% of the popular vote.
Members of Parliament
This riding has elected the following Members of Parliament:
| Parliament | Years | Member | Party | |
|---|---|---|---|---|
| Abbotsford Riding created from Fraser Valley and Langley—Abbotsford |
||||
| 38th | 2004–2006 | Randy White | Conservative | |
| 39th | 2006–2008 | Ed Fast | ||
| 40th | 2008–2011 | |||
| 41st | 2011–2015 | |||
| 42nd | 2015–2019 | |||
| 43rd | 2019–present | |||
Current Member of Parliament
Abbotsford's MP is Ed Fast. He is a member of the Conservative Party of Canada and was first elected in the 2006 election. He is a former Abbotsford city councillor and has worked as a lawyer, having earned a law degree at University of British Columbia. During the 40th Parliament, since January 2009, he was the chair of the Standing Committee on Justice and Human Rights and a member of the Liaison Committee.
Election results
| 2019 Canadian federal election | ||||||||
|---|---|---|---|---|---|---|---|---|
| Party | Candidate | Votes | % | ±% | Expenditures | |||
| Conservative | Ed Fast | 25,162 | 51.4 | +3.13 | $70,532.49 | |||
| Liberal | Seamus Heffernan | 10,560 | 21.6 | -11.46 | $22,436.34 | |||
| New Democratic | Madeleine Sauve | 8,257 | 16.9 | +3.29 | none listed | |||
| Green | Stephen Fowler | 3,702 | 7.6 | +3.32 | $575.00 | |||
| People's | Locke Duncan | 985 | 2.0 | – | $4,252.19 | |||
| Christian Heritage | Aeriol Alderking | 270 | 0.6 | – | none listed | |||
| Total valid votes/Expense limit | 48,936 | 100.0 | ||||||
| Total rejected ballots | 403 | |||||||
| Turnout | 49,339 | 65.9 | ||||||
| Eligible voters | 74,814 | |||||||
| Conservative hold | Swing | +7.29 | ||||||
| Source: Elections Canada[10][11] | ||||||||
| 2015 Canadian federal election | ||||||||
|---|---|---|---|---|---|---|---|---|
| Party | Candidate | Votes | % | ±% | Expenditures | |||
| Conservative | Ed Fast | 23,229 | 48.27 | -18.61 | $76,055.10 | |||
| Liberal | Peter Njenga | 15,777 | 32.78 | +24.08 | $14,078.53 | |||
| New Democratic | Jen Martel | 6,593 | 13.70 | -5.54 | $11,592.31 | |||
| Green | Stephen Fowler | 2,416 | 5.02 | +0.37 | $2,578.52 | |||
| Marxist–Leninist | David MacKay | 109 | 0.23 | -0.30 | – | |||
| Total valid votes/Expense limit | 48,124 | 100.00 | $202,055.26 | |||||
| Total rejected ballots | 202 | 0.42 | – | |||||
| Turnout | 48,326 | 69.74 | – | |||||
| Eligible voters | 69,299 | |||||||
| Conservative hold | Swing | -21.35 | ||||||
| Source: Elections Canada[12][13][14] | ||||||||
| 2011 federal election redistributed results[15] | |||
|---|---|---|---|
| Party | Vote | % | |
| Conservative | 25,060 | 66.88 | |
| New Democratic | 7,209 | 19.24 | |
| Liberal | 3,260 | 8.70 | |
| Green | 1,744 | 4.65 | |
| Marxist-Leninist | 196 | 0.52 | |
| 2011 Canadian federal election | ||||||||
|---|---|---|---|---|---|---|---|---|
| Party | Candidate | Votes | % | ±% | ||||
| Conservative | Ed Fast | 32,493 | 65.02 | +1.70 | ||||
| New Democratic | David Murray | 10,089 | 20.19 | +6.97 | ||||
| Liberal | Madeleine Hardin | 4,968 | 9.94 | -6.34 | ||||
| Green | Daniel Bryce | 2,138 | 4.28 | -2.17 | ||||
| Marxist–Leninist | David MacKay | 286 | 0.57 | – | ||||
| Total valid votes | 49,974 | 100.0 | ||||||
| Total rejected ballots | 225 | 0.45 | -0.07 | |||||
| Turnout | 50,199 | 59.67 | +1 | |||||
| Conservative hold | Swing | -2.64 | ||||||
| 2008 Canadian federal election | ||||||||
|---|---|---|---|---|---|---|---|---|
| Party | Candidate | Votes | % | ±% | Expenditures | |||
| Conservative | Ed Fast | 30,853 | 63.32 | +0.05 | $79,097 | |||
| Liberal | Lionel Traverse | 7,933 | 16.28 | +3.61 | $63,013 | |||
| New Democratic | Bonnie Rai | 6,444 | 13.22 | -3.75 | $4,907 | |||
| Green | Karen Durant | 3,141 | 6.45 | +0.64 | $833 | |||
| Marijuana | Tim Felger | 358 | 0.73 | +0.03 | ||||
| Total valid votes/Expense limit | 48,729 | 100.0 | $86,855 | |||||
| Total rejected ballots | 256 | 0.52 | +0.13 | |||||
| Turnout | 48,985 | 59 | -2 | |||||
| Conservative hold | Swing | -1.78 | ||||||
| 2006 Canadian federal election | ||||||||
|---|---|---|---|---|---|---|---|---|
| Party | Candidate | Votes | % | ±% | Expenditures | |||
| Conservative | Ed Fast | 29,825 | 63.27 | +1.90 | $68,269 | |||
| New Democratic | Jeffrey Hansen-Carlson | 8,004 | 16.97 | +3.34 | $6,955 | |||
| Liberal | David Oliver | 5,976 | 12.67 | -7.27 | $22,258 | |||
| Green | Stephanie Ashley-Pryce | 2,740 | 5.81 | +2.93 | ||||
| Marijuana | Tim Felger | 334 | 0.70 | -0.13 | ||||
| Canadian Action | Richard Gebert | 173 | 0.36 | – | $80 | |||
| Marxist–Leninist | David S. MacKay | 86 | 0.18 | +0.08 | ||||
| Total valid votes | 47,138 | 100.0 | ||||||
| Total rejected ballots | 183 | 0.39 | ||||||
| Turnout | 47,321 | 60.69 | ||||||
| Conservative hold | Swing | -0.72 | ||||||
| David Oliver was registered as the Liberal candidate, but lost the support of the Liberal Party, and would not have sat with the Liberal caucus had he been he be elected until cleared of allegations made by the NDP candidate. | ||||||||
| 2004 Canadian federal election | ||||||||
|---|---|---|---|---|---|---|---|---|
| Party | Candidate | Votes | % | ±% | Expenditures | |||
| Conservative | Randy White | 29,587 | 61.37 | -14.8 | $66,946 | |||
| Liberal | Moe Gill | 9,617 | 19.94 | +2.3 | $41,240 | |||
| New Democratic | Scott Fast | 6,575 | 13.63 | +9.7 | $7,584 | |||
| Green | Karl Hann | 1,389 | 2.88 | – | $539 | |||
| Christian Heritage | Harold J. Ludwig | 585 | 1.21 | – | $2,075 | |||
| Marijuana | Tim Felger | 404 | 0.83 | – | $9,999 | |||
| Marxist–Leninist | David S. MacKay | 51 | 0.10 | – | ||||
| Total valid votes | 48,208 | 100.0 | ||||||
| Total rejected ballots | 182 | 0.38 | ||||||
| Turnout | 48,390 | 64.57 | ||||||
| Conservative notional hold | Swing | -9 | ||||||
| Change based on redistributed results. Conservative change based on combined total of the Canadian Alliance and the Progressive Conservative Party. | ||||||||
References
- "(Code 59001) Census Profile". 2011 census. Statistics Canada. 2012. Retrieved 2011-03-06.
- Library of Parliament Riding Profile
- Expenditures - 2004
Notes
- Statistics Canada: 2012
- https://www12.statcan.gc.ca/census-recensement/2016/dp-pd/hlt-fst/pd-pl/Table.cfm?Lang=Eng&T=501&S=46&O=A
- Pundit's Guide
- "Religion (13) and Age Groups (8) for Population, for Canada, Provinces, Territories and Federal Electoral Districts (2003 Representation Order), 2001 Census - 20% Sample Data". 2.statcan.gc.ca. Retrieved 2012-11-20.
- "2001 Census of Canada: Topic-based tabulations". 2.statcan.ca. 2012-07-04. Retrieved 2012-11-30.
- "2Profile of Ethnic Origin and Visible Minorities for Canada, Provinces, Territories and Federal Electoral Districts (2003 Representation Order), 2006 Census". 2.statcan.gc.ca. Retrieved 2012-12-02.
- Abbotsford Electoral Boundary Description
- Final Report – British Columbia
- Timeline for the Redistribution of Federal Electoral Districts
- "List of confirmed candidates". Elections Canada. Retrieved October 4, 2019.
- "Election Night Results". Elections Canada. Retrieved November 17, 2019.
- Elections Canada – Confirmed candidates for Abbotsford, 30 September 2015
- Official Voting Results - Abbotsford
- "Elections Canada Online - Final Candidates Election Expenses Limits". elections.ca. Archived from the original on August 15, 2015.
- Pundits' Guide to Canadian Elections