Skeena—Bulkley Valley
Skeena—Bulkley Valley is a federal electoral district in British Columbia, Canada, that has been represented in the House of Commons of Canada since 2004.
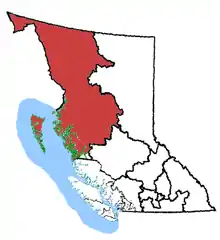 Skeena—Bulkley Valley in relation to other British Columbia federal electoral districts | |||
| Coordinates: | 57.481°N 130.4945°W | ||
| Federal electoral district | |||
| Legislature | House of Commons | ||
| MP |
New Democratic | ||
| District created | 2003 | ||
| First contested | 2004 | ||
| Last contested | 2019 | ||
| District webpage | profile, map | ||
| Demographics | |||
| Population (2011)[1] | 90,586 | ||
| Electors (2015) | 62,234 | ||
| Area (km²)[1] | 327,275 | ||
| Pop. density (per km²) | 0.28 | ||
| Census division(s) | Kitimat-Stikine, Skeena-Queen Charlotte, Stikine, Bulkley-Nechako, Central Coast | ||
| Census subdivision(s) | Bulkley-Nechako Electoral Areas A, B, C, D, E, & G, Burns Lake, Central Coast Electoral Areas A (Northern section), B, D & E, Fort St. James, Fraser Lake, Granisle, Houston, Kitimat, Prince Rupert, Smithers, Terrace, Telkwa | ||
- This page is about the federal electoral district. See Bulkley Valley for that geographic region, and Skeena River for the region known as "the Skeena".
Geography
This is a mostly wilderness area comprising almost the entire northwestern quarter of British Columbia, including the islands of Haida Gwaii and the large region inland from the Alaska Panhandle.
This district includes the cities of Terrace and Prince Rupert, the town of Smithers, as well as the districts of Kitimat, Hazelton, New Hazelton, Stewart, Port Edward, Houston and the villages of Masset, Burns Lake, Granisle, Telkwa and Port Clements.
Demographics
| Ethnic groups in Skeena—Bulkley Valley (2016) Source: | Population | % | |
|---|---|---|---|
| Ethnic group | European | 55,595 | 63.2% |
| Aboriginal | 29,115 | 33.1% | |
| South Asian | 1,175 | 1.3% | |
| Filipino | 760 | 0.9% | |
| Southeast Asian | 570 | 0.6% | |
| Chinese | 565 | 0.6% | |
| Black | 460 | 0.5% | |
| Japanese | 240 | 0.3% | |
| Latin American | 225 | 0.3% | |
| Korean | 135 | 0.2% | |
| West Asian | 40 | 0% | |
| Arab | 25 | 0% | |
| Multiple minorities | 125 | 0.1% | |
| Visible minority, n.i.e. | 85 | 0.1% | |
| Total population | 88,920 | 100% | |
History
This electoral district was created in 2003 from Skeena, some of Prince George—Bulkley Valley and a small part of Cariboo—Chilcotin riding.
The 2012 federal electoral boundaries redistribution concluded that the electoral boundaries of Skeena—Bulkley Valley should be adjusted slightly, and a modified electoral district of the same name has been contested in elections thereafter.[2] The redefined Skeena—Bulkley Valley gained a small portion of territory in the upper Bella Coola Valley from the district of Cariboo—Prince George but was otherwise unchanged. These new boundaries were legally defined in the 2013 representation order, which came come into effect upon the call of the 2015 election.[3]
Member of Parliament
This riding has elected the following Member of Parliament:
| Parliament | Years | Member | Party | |
|---|---|---|---|---|
| Skeena—Bulkley Valley Riding created from Skeena, Prince George—Bulkley Valley and Cariboo—Chilcotin |
||||
| 38th | 2004–2006 | Nathan Cullen | New Democratic | |
| 39th | 2006–2008 | |||
| 40th | 2008–2011 | |||
| 41st | 2011–2015 | |||
| 42nd | 2015–2019 | |||
| 43rd | 2019–present | Taylor Bachrach | ||
Current Member of Parliament
Its Member of Parliament is Taylor Bachrach, who was formerly the mayor of Smithers, British Columbia.
Election results
| 2019 Canadian federal election | ||||||||
|---|---|---|---|---|---|---|---|---|
| Party | Candidate | Votes | % | ±% | Expenditures | |||
| New Democratic | Taylor Bachrach | 16,944 | 40.9 | -10.18 | $95,825.47 | |||
| Conservative | Claire Rattée | 13,756 | 33.2 | +8.41 | none listed | |||
| Liberal | Dave Birdi | 4,793 | 11.6 | -7.12 | $33,859.91 | |||
| Green | Mike Sawyer | 3,280 | 7.9 | +4.26 | $7,326.84 | |||
| Christian Heritage | Rod Taylor | 1,350 | 3.3 | +1.53 | $23,458.48 | |||
| People's | Jody Craven | 940 | 2.3 | – | $5,358.59 | |||
| Independent | Danny Nunes | 164 | 0.4 | – | none listed | |||
| Independent | Merv Ritchie | 157 | 0.4 | – | none listed | |||
| Total valid votes/Expense limit | 41,384 | 100.0 | ||||||
| Total rejected ballots | 267 | 0.61 | ||||||
| Turnout | 41,651 | 62.7 | ||||||
| Eligible voters | 66,421 | |||||||
| Source: Elections Canada[4][5] | ||||||||
| 2015 Canadian federal election | ||||||||
|---|---|---|---|---|---|---|---|---|
| Party | Candidate | Votes | % | ±% | Expenditures | |||
| New Democratic | Nathan Cullen | 22,531 | 51.08 | -4.14 | $64,149.53 | |||
| Conservative | Tyler Nesbitt | 10,936 | 24.79 | -9.77 | $57,890.26 | |||
| Liberal | Brad Layton | 8,257 | 18.72 | +15.11 | $8,887.53 | |||
| Green | Jeannie Parnell | 1,605 | 3.64 | +0.44 | – | |||
| Christian Heritage | Don Spratt | 780 | 1.77 | -1.19 | $20,710.97 | |||
| Total valid votes/Expense limit | 44,109 | 100.00 | $247,884.67 | |||||
| Total rejected ballots | 157 | 0.35 | – | |||||
| Turnout | 44,266 | 69.76 | – | |||||
| Eligible voters | 63,459 | |||||||
| New Democratic hold | Swing | +2.81 | ||||||
| Source: Elections Canada[6][7] | ||||||||
| 2011 federal election redistributed results[8] | |||
|---|---|---|---|
| Party | Vote | % | |
| New Democratic | 19,550 | 55.22 | |
| Conservative | 12,236 | 34.56 | |
| Liberal | 1,278 | 3.60 | |
| Others | 1,208 | 3.41 | |
| Green | 1,131 | 3.19 | |
| 2011 Canadian federal election | ||||||||
|---|---|---|---|---|---|---|---|---|
| Party | Candidate | Votes | % | ±% | ||||
| New Democratic | Nathan Cullen | 19,431 | 55.33 | +5.49 | ||||
| Conservative | Clay Harmon | 12,117 | 34.50 | -1.86 | ||||
| Liberal | Kyle Warwick | 1,268 | 3.61 | -1.93 | ||||
| Green | Roger Benham | 1,102 | 3.14 | -1.52 | ||||
| Christian Heritage | Rod Taylor | 1,038 | 2.96 | -0.29 | ||||
| Canadian Action | Maggie Braun | 165 | 0.47 | +0.15 | ||||
| Total valid votes/Expense limit | 35,121 | 100.0 | ||||||
| Total rejected ballots | 116 | 0.33 | +0.02 | |||||
| Turnout | 35,237 | 58.86 | +2.35 | |||||
| New Democratic hold | Swing | +3.68 | ||||||
| 2008 Canadian federal election | ||||||||
|---|---|---|---|---|---|---|---|---|
| Party | Candidate | Votes | % | ±% | Expenditures | |||
| New Democratic | Nathan Cullen | 17,219 | 49.84 | +1.51 | $68,962 | |||
| Conservative | Sharon Smith | 12,561 | 36.36 | +3.36 | $78,636 | |||
| Liberal | Corinna Morhart | 1,916 | 5.54 | -7.12 | $11,687 | |||
| Green | Hondo Arendt | 1,613 | 4.66 | +1.88 | $511 | |||
| Christian Heritage | Rod Taylor | 1,125 | 3.25 | +0.03 | $28,231 | |||
| Canadian Action | Mary-Etta Goodacre | 112 | 0.32 | – | $120 | |||
| Total valid votes/Expense limit | 34,546 | 100.0 | $97,941 | |||||
| Total rejected ballots | 106 | 0.31 | -0.01 | |||||
| Turnout | 34,652 | 56.51 | -6.62 | |||||
| New Democratic hold | Swing | -0.92 | ||||||
| 2006 Canadian federal election | ||||||||
|---|---|---|---|---|---|---|---|---|
| Party | Candidate | Votes | % | ±% | Expenditures | |||
| New Democratic | Nathan Cullen | 18,496 | 48.33 | +11.19 | $90,144 | |||
| Conservative | Michael Scott | 12,630 | 33.00 | -0.70 | $71,817 | |||
| Liberal | Gordon Stamp-Vincent | 4,845 | 12.66 | -8.93 | $19,599 | |||
| Christian Heritage | Rod Taylor | 1,235 | 3.22 | -0.60 | $23,835 | |||
| Green | Phil Brienesse | 1,064 | 2.78 | -0.54 | $7,533 | |||
| Total valid votes | 38,270 | 100.0 | ||||||
| Total rejected ballots | 122 | 0.32 | -0.06 | |||||
| Turnout | 38,392 | 63.13 | ||||||
| New Democratic hold | Swing | +5.25 | ||||||
| 2004 Canadian federal election | ||||||||
|---|---|---|---|---|---|---|---|---|
| Party | Candidate | Votes | % | |||||
| New Democratic | Nathan Cullen | 13,706 | 37.14 | |||||
| Conservative | Andy Burton | 12,434 | 33.70 | |||||
| Liberal | Miles Richardson | 7,965 | 21.59 | |||||
| Christian Heritage | Rod Taylor | 1,408 | 3.82 | |||||
| Green | Roger Colin Benham | 1,225 | 3.32 | |||||
| Marxist–Leninist | Frank Martin | 161 | 0.44 | |||||
| Total valid votes | 36,899 | 100.00 | ||||||
| Total rejected ballots | 140 | 0.38 | ||||||
| Turnout | 37,039 | |||||||
| This riding was created from Skeena, Prince George—Bulkley Valley and Cariboo—Chilcotin, which each elected a Canadian Alliance candidate in the last election. Andy Burton was the incumbent from Skeena. | ||||||||
References
- "(Code 59025) Census Profile". 2011 census. Statistics Canada. 2012. Retrieved 2011-03-06.
- Library of Parliament Riding Profile
- Expenditures - 2004
Notes
- Statistics Canada: 2012
- Final Report – British Columbia
- Timeline for the Redistribution of Federal Electoral Districts
- "List of confirmed candidates". Elections Canada. Retrieved October 4, 2019.
- "Election Night Results". Elections Canada. Retrieved November 16, 2019.
- Elections Canada – Confirmed candidates for Skeena—Bulkley Valley, 30 September 2015
- Elections Canada – Preliminary Election Expenses Limits for Candidates
- Pundits' Guide to Canadian Elections
External links
- Website of the Parliament of Canada