Basildon (UK Parliament constituency)
Basildon was a parliamentary constituency represented in the House of Commons of the Parliament of the United Kingdom. It elected one Member of Parliament (MP) by the first past the post system of election.
| Basildon | |
|---|---|
| Former Borough constituency for the House of Commons | |
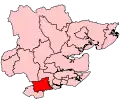
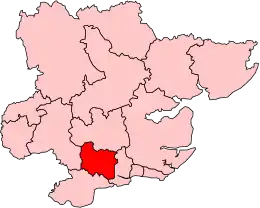
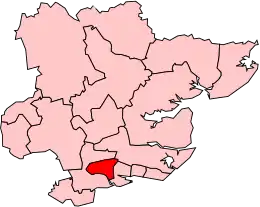
 Boundary of Basildon in Essex in 2005. | |
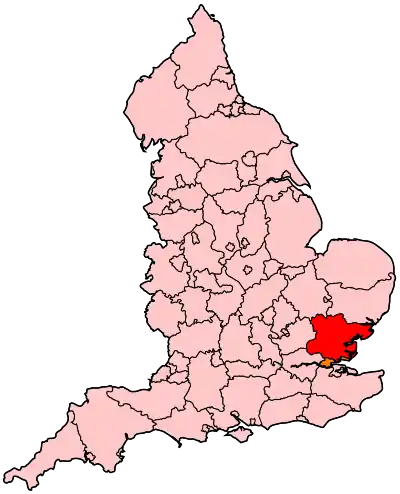
 Location of Essex within England. | |
| County | Essex |
| February 1974–2010 | |
| Number of members | One |
| Replaced by | Basildon and Billericay, South Basildon and East Thurrock |
| Created from | Billericay |
History
The seat was created for the February 1974 general election from the majority of the abolished constituency of Billericay. Its electorate was reduced for the 1983 general election when Billericay was re-established. It underwent a major redistributions for the 1997 election and again for the 2010 election, when it was renamed as South Basildon and East Thurrock.
It was one of the best known bellwether constituencies in Britain, having voted for the winning party in each election for the duration of its existence. The failure of the Labour Party to win it in the 1992 election — Basildon would be the first to declare of all the marginal seats — foreshadowed Labour's fourth straight defeat at the hands of the Conservative Party.
Boundaries and boundary changes


1974–1983: The Urban District of Basildon.[1]
Formed from part of the abolished County Constituency of Billericay, comprising the former Urban District thereof, which had been reconstituted as the Urban District of Basildon.
1983–1997: The District of Basildon wards of Fryerns Central, Fryerns East, Langdon Hills, Lee Chapel North, Nethermayne, Pitsea East, Pitsea West, and Vange.[2]
Northern parts, including Billericay and Wickford transferred to the re-established constituency of Billericay.
1997–2010: The District of Basildon wards of Fryerns Central, Fryerns East, Langdon Hills, Lee Chapel North, Nethermayne, and Vange, and the Borough of Thurrock wards of Corringham and Fobbing, Orsett, Stanford-le-Hope, and The Homesteads.[3]
Major realignment of boundaries with Billericay; Pitsea was transferred to Billericay in exchange for the northern part of the Borough of Thurrock.
Following their review of parliamentary representation in Essex, the Boundary Commission for England made radical changes to all parliamentary constituencies in the county for the 2010 general election, and the Basildon constituency was divided. The majority of the seat formed the basis of the new South Basildon and East Thurrock constituency, while the wards around central Basildon were merged with the bulk of the former Billericay constituency to form a new seat called Basildon and Billericay.
Profile
Basildon was a (famously) Conservative seat between 1979 and 1997 as the quintessential "Essex man" constituency based on the new town of Basildon. Much of its population has its origins in the East End of London, who as a group traditionally voted for the Labour Party.
However, throughout the 1980s and until the Labour landslide victory of 1997, many voters in the area transferred their loyalties to the Conservative Party. The MP throughout that period was David Amess, who himself originated from east London (Plaistow), and now holds the safer seat of Southend West.
Labour took the seat in 1997 and 2001 with a large majority, and in 2005 with a reduced majority. Basildon thus proved to be a "bellwether" seat, voting for the eventual winning party since 1974.
Both the successor seats that replaced Basildon in 2010 were considered to be much less favourable to Labour than the old Basildon seat, ending Basildon's bellwether status.[4]
Members of Parliament
| Election | Member[5] | Party | |
|---|---|---|---|
| February 1974 | Eric Moonman | Labour | |
| 1979 | Harvey Proctor | Conservative | |
| 1983 | David Amess | Conservative | |
| 1997 | Angela Smith | Labour Co-op | |
| 2010 | constituency abolished: see South Basildon and East Thurrock and Basildon and Billericay | ||
Elections
Elections in the 1970s
| Party | Candidate | Votes | % | ±% | |
|---|---|---|---|---|---|
| Labour | Eric Moonman | 33,499 | 45.2 | ||
| Conservative | Ronald Denney | 22,832 | 30.8 | ||
| Liberal | Edward Fortune | 17,794 | 24.0 | ||
| Majority | 10,667 | 14.4 | |||
| Turnout | 74,125 | 82.0 | |||
| Labour win (new seat) | |||||
| Party | Candidate | Votes | % | ±% | |
|---|---|---|---|---|---|
| Labour | Eric Moonman | 32,298 | 47.9 | +2.7 | |
| Conservative | David Atkinson | 21,747 | 32.2 | +1.4 | |
| Liberal | Edward Fortune | 12,816 | 19.0 | −5.0 | |
| Ind. Labour Party | Robert Chaplin | 599 | 0.9 | New | |
| Majority | 10,551 | 15.6 | +1.2 | ||
| Turnout | 67,460 | 73.8 | −8.2 | ||
| Labour hold | Swing | +0.6 | |||
| Party | Candidate | Votes | % | ±% | |
|---|---|---|---|---|---|
| Conservative | Harvey Proctor | 37,919 | 46.9 | +14.7 | |
| Labour | Eric Moonman | 32,739 | 40.5 | −7.4 | |
| Liberal | Raymond Auvray | 9,280 | 11.5 | −7.5 | |
| Majority | 5,180 | 6.4 | N/A | ||
| Turnout | 79,938 | 78.0 | +5.2 | ||
| Conservative gain from Labour | Swing | +11.05 | |||
Elections in the 1980s
Note: This constituency underwent boundary changes after the 1979 election, so was notionally a Labour seat.
| Party | Candidate | Votes | % | ±% | |
|---|---|---|---|---|---|
| Conservative | David Amess | 17,516 | 38.7 | +3.6 | |
| Labour Co-op | Julian Fulbrook | 16,137 | 35.6 | −17.0 | |
| SDP | Sue Slipman | 11,634 | 25.7 | +14.4 | |
| Majority | 1,379 | 3.0 | N/A | ||
| Turnout | 45,287 | 69.0 | −9.0 | ||
| Conservative gain from Labour | Swing | +10.3 | |||
| Party | Candidate | Votes | % | ±% | |
|---|---|---|---|---|---|
| Conservative | David Amess | 21,858 | 43.5 | +4.8 | |
| Labour Co-op | Julian Fulbrook | 19,209 | 38.3 | +2.7 | |
| Liberal | Raymond Auvray | 9,139 | 18.2 | −7.5 | |
| Majority | 2,649 | 5.3 | +2.3 | ||
| Turnout | 50,206 | 73.8 | +4.8 | ||
| Conservative hold | Swing | +1.1 | |||
Elections in the 1990s
| Party | Candidate | Votes | % | ±% | |
|---|---|---|---|---|---|
| Conservative | David Amess | 24,159 | 44.9 | +1.4 | |
| Labour Co-op | John Potter | 22,679 | 42.2 | +3.9 | |
| Liberal Democrats | Geoffrey Williams | 6,967 | 12.9 | −5.3 | |
| Majority | 1,480 | 2.7 | −2.6 | ||
| Turnout | 53,805 | 79.8 | +6.0 | ||
| Conservative hold | Swing | −1.3 | |||
Due to constituency boundary changes between 1992 and 1997, the changes in percentage of vote share in 1997 are given relative to the notional 1992 results, which reflect what the results would have been in 1992 had the election been fought with the 1997 boundaries.
| Party | Candidate | Votes | % | ±% | |
|---|---|---|---|---|---|
| Labour Co-op | Angela Smith | 29,646 | 55.8 | +15.1 | |
| Conservative | John Baron | 16,366 | 30.8 | −14.2 | |
| Liberal Democrats | Lindsay Granshaw | 4,608 | 8.7 | −6.5 | |
| Referendum | Craig Robinson | 2,462 | 4.6 | New | |
| Majority | 13,280 | 25.0 | N/A | ||
| Turnout | 53,082 | 72.0 | −7.6 | ||
| Labour Co-op gain from Conservative | Swing | +14.7 | |||
Elections in the 2000s
| Party | Candidate | Votes | % | ±% | |
|---|---|---|---|---|---|
| Labour Co-op | Angela Smith | 21,551 | 52.7 | −3.1 | |
| Conservative | Dominic Schofield | 13,813 | 33.8 | +3.0 | |
| Liberal Democrats | Jane Smithard | 3,691 | 9.0 | +0.3 | |
| UKIP | Frank Mallon | 1,397 | 3.4 | New | |
| Socialist Alliance | Dick Duane | 423 | 1.0 | New | |
| Majority | 7,738 | 18.9 | -6.1 | ||
| Turnout | 40,875 | 55.1 | −16.9 | ||
| Labour Co-op hold | Swing | −3.0 | |||
| Party | Candidate | Votes | % | ±% | |
|---|---|---|---|---|---|
| Labour Co-op | Angela Smith | 18,720 | 43.4 | −9.3 | |
| Conservative | Aaron Powell | 15,578 | 36.1 | +2.3 | |
| Liberal Democrats | Martin Thompson | 4,473 | 10.4 | +1.4 | |
| BNP | Emma Colgate | 2,055 | 4.8 | New | |
| UKIP | Alix Blythe | 1,143 | 2.6 | −0.8 | |
| Green | Vikki Copping | 662 | 1.5 | New | |
| English Democrat | Kim Gandy | 510 | 1.2 | New | |
| Majority | 3,142 | 7.3 | -11.6 | ||
| Turnout | 43,141 | 58.4 | +3.3 | ||
| Labour Co-op hold | Swing | −5.8 | |||
Notes and references
- "The Parliamentary Constituencies (England) Order 1970". www.legislation.gov.uk. Retrieved 2019-09-09.
- "The Parliamentary Constituencies (England) Order 1983". www.legislation.gov.uk. Retrieved 2019-09-09.
- "The Parliamentary Constituencies (England) Order 1995". www.legislation.gov.uk. Retrieved 2019-09-09.
- Waller, Robert; Criddle, Byron (2007). The Almanac of British Politics (8th ed.). UK: Routledge. pp. 127–128, 160–161. ISBN 0-415-37823-0.
- Leigh Rayment's Historical List of MPs – Constituencies beginning with "B" (part 1)
- "Election Data 1983". Electoral Calculus. Archived from the original on 15 October 2011. Retrieved 18 October 2015.
- "Election Data 1987". Electoral Calculus. Archived from the original on 15 October 2011. Retrieved 18 October 2015.
- "Election Data 1992". Electoral Calculus. Archived from the original on 15 October 2011. Retrieved 18 October 2015.
- "Politics Resources". Election 1992. Politics Resources. 9 April 1992. Archived from the original on 24 July 2011. Retrieved 2010-12-06.
- "Election Data 1997". Electoral Calculus. Archived from the original on 15 October 2011. Retrieved 18 October 2015.
- "Election Data 2001". Electoral Calculus. Archived from the original on 15 October 2011. Retrieved 18 October 2015.
- "Election Data 2005". Electoral Calculus. Archived from the original on 15 October 2011. Retrieved 18 October 2015.