1983 United Kingdom general election
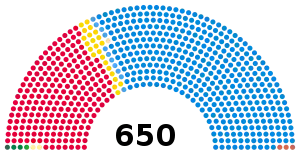
The 1983 United Kingdom general election was held on Thursday 9 June 1983. It gave the Conservative Party under the leadership of Margaret Thatcher the most decisive election victory since that of the Labour Party in 1945, with a landslide majority of 144 seats.
| |||||||||||||||||||||||||||||||||||||||||||||||||
All 650 seats in the House of Commons 326 seats needed for a majority | |||||||||||||||||||||||||||||||||||||||||||||||||
|---|---|---|---|---|---|---|---|---|---|---|---|---|---|---|---|---|---|---|---|---|---|---|---|---|---|---|---|---|---|---|---|---|---|---|---|---|---|---|---|---|---|---|---|---|---|---|---|---|---|
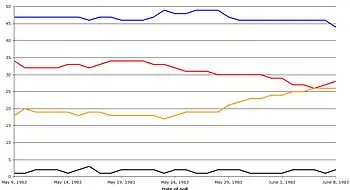
| Opinion polls | |||||||||||||||||||||||||||||||||||||||||||||||||
| Turnout | 72.7%, | ||||||||||||||||||||||||||||||||||||||||||||||||
| |||||||||||||||||||||||||||||||||||||||||||||||||
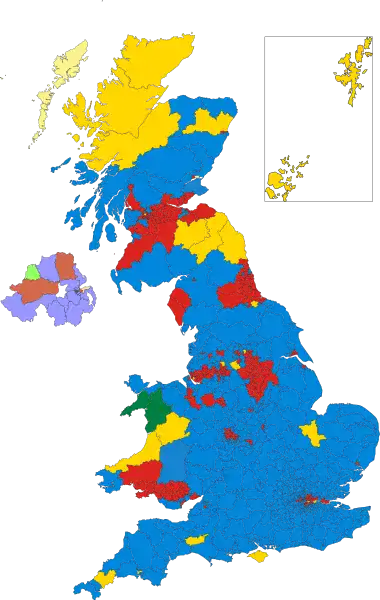 Colours denote the winning party—as shown in § Results | |||||||||||||||||||||||||||||||||||||||||||||||||
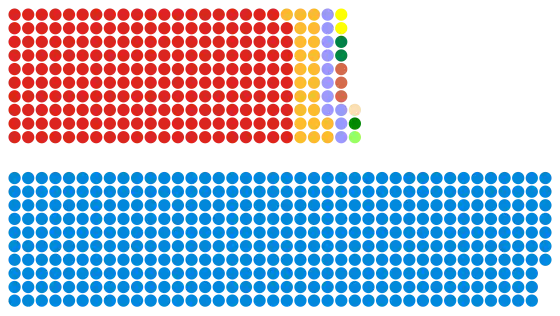 Composition of the House of Commons after the election | |||||||||||||||||||||||||||||||||||||||||||||||||
| |||||||||||||||||||||||||||||||||||||||||||||||||
.jpg.webp)
.jpg.webp)

Thatcher's first term as Prime Minister had not been an easy time.[1] Unemployment increased during the first three years of her premiership and the economy went through a recession. However, the British victory in the Falklands War led to a recovery of her personal popularity; the economy had also returned to growth. By the time Thatcher called the election in May 1983, the Conservatives were most people's firm favourites to win the general election. The resulting win earned the Conservatives their biggest parliamentary majority of the post-war era, and their second-biggest majority as a single-party government, behind only the 1924 election (they earned even more seats in the 1931 election, but were part of the National Government).[2]
The Labour Party had been led by Michael Foot since the resignation of former Prime Minister James Callaghan in 1980. They had fared well in opinion polls and local elections during this time, but issues developed which would lead directly to their defeat. Labour adopted a platform that was considered more left-wing than usual.[2][3] Several moderate Labour MPs had defected from the party to form the Social Democratic Party (SDP); they then formed the SDP–Liberal Alliance with the existing Liberal Party.
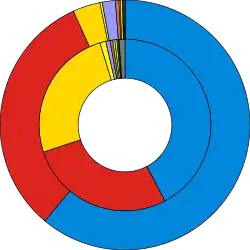
The opposition vote split almost evenly between the Alliance and Labour. With its worst electoral performance since 1918, the Labour vote fell by over 3 million votes from 1979 and this accounted for both a national swing of almost 4% towards the Conservatives and their larger parliamentary majority of 144 seats, even though the Conservatives' total vote fell by almost 700,000. This was the last general election until 2015 in which a governing party increased its number of seats.
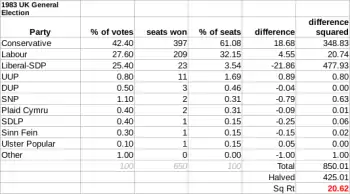
The Alliance finished in third place but came within 700,000 votes of out-polling Labour; by gaining 25.4% of the vote it won the largest percentage for any third party since sixty years prior. Despite this, it won only 23 seats, whereas Labour won 209. The Liberals argued that a proportional electoral system would have given them a more representative number of MPs. Changing the electoral system had been a long-running Liberal Party campaign plank, and would later be adopted by the Liberal Democrats.
The election night was broadcast live on the BBC, and was presented by David Dimbleby, Sir Robin Day and Peter Snow.[4] It was also broadcast on ITV, and presented by Alastair Burnet, Peter Sissons and Martyn Lewis.
Three future leaders of the Labour Party (Tony Blair, Gordon Brown and Jeremy Corbyn) were first elected at this election; Blair and Brown went on to hold the office of Prime Minister. Former Labour Prime Minister Harold Wilson, Shirley Williams, Bill Rodgers, Joan Lestor, Tony Benn as well as Speaker of the House of Commons and former Labour cabinet minister George Thomas left the House of Commons as a result of this election, although Benn would return in a by-election the following year, and Lestor at the following general election. In addition, two future Leaders of the Liberal Democrats were first elected (Paddy Ashdown and Charles Kennedy), and one of the Conservative Party (Michael Howard).
Background and campaign
Michael Foot was elected leader of the Labour Party in 1980, replacing James Callaghan. The election of Foot signalled that the core of the party was swinging to the left and the move exacerbated divisions within the party. In 1981 a group of senior figures including Roy Jenkins, David Owen, Bill Rodgers and Shirley Williams left Labour to found the Social Democratic Party (SDP). The SDP agreed to a pact with the Liberals for the 1983 election and stood as "The Alliance".
The election did not have to be held for another year. Although political circumstances were clearly favourable for the government and opposition parties anticipated that Mrs Thatcher would go to the country in June, earlier in 1983 the Conservatives were split on the timing of the election. One faction favoured a June election, but another group wanted to wait until October before going to the country, while some within the Party even advocated delaying the contest until 1984. Supporters of waiting to a later time to hold an election included Thatcher's deputy and Home Secretary Willie Whitelaw and John Biffen who was then serving as Leader of the House of Commons.[5] On 27 April it was reported that all the Conservative party's regional agents had unanimously expressed a preference to Thatcher for a June election, although some members of her cabinet were advising her to wait until October.[6] On 8 May senior Conservatives met at Chequers and agreed to go to the country on 9 June. The election was formally called the next day and Parliament was dissolved on 13 May for a four-week official election campaign.[5]
The campaign displayed the huge divisions between the two major parties. Thatcher had been highly unpopular during her first two years in office until the swift and decisive victory in the Falklands War, coupled with an improving economy, considerably raised her standings in the polls. The Conservatives' key issues included employment, economic growth and defence. Labour's campaign manifesto involved leaving the European Economic Community, abolishing the House of Lords, abandoning the United Kingdom's nuclear deterrent by cancelling Trident and removing cruise missiles—a programme dubbed by Labour MP Gerald Kaufman "the longest suicide note in history"; "Although, at barely 37 pages, it only seemed interminable", noted Roy Hattersley. Pro-Labour political journalist Michael White, writing in The Guardian, commented: "There was something magnificently brave about Michael Foot's campaign but it was like the Battle of the Somme."[7]
National election, 1979
Following boundary changes in 1983, the BBC and ITN (Independent Television News) co-produced a calculation of how the 1979 general election would have gone if fought on the new 1983 boundaries. The following table shows the effects of the boundary changes on the House of Commons:
| Party | Seats | Gains | Losses | Net gain/loss | Seats % | Votes % | Votes | +/− | |
|---|---|---|---|---|---|---|---|---|---|
| Conservative | 359 | +20 | 55 | 44.9 | 13,703,429 | ||||
| Labour | 261 | −8 | 40 | 37.7 | 11,512,877 | ||||
| Liberal | 9 | −2 | 1 | 14.2 | 4,324,936 | ||||
| SNP | 2 | 0 | 0 | 1.6 | 497,128 | ||||
| Plaid Cymru | 2 | 0 | 0 | 0.4 | 135,241 | ||||
| Other parties | 17 | +5 | 3 | 3.4 | 1,063,263 | ||||
Timeline
Prime Minister Margaret Thatcher visited Buckingham Palace on the afternoon of 9 May and asked the Queen to dissolve Parliament on 13 May, announcing that the election would be held on 9 June. The key dates were as follows:
| Friday 13 May | Dissolution of the 48th Parliament and campaigning officially begins |
| Monday 23 May | Last day to file nomination papers; 2,579 candidates enter |
| Wednesday 8 June | Campaigning officially ends |
| Thursday 9 June | Polling day |
| Friday 10 June | The Conservative Party wins with a majority of 144 to retain power |
| Wednesday 15 June | 49th Parliament assembles |
| Wednesday 22 June | State Opening of Parliament |
Results
The election saw a landslide victory for the Conservatives, achieving their best results since 1935. Although there was a slight drop in their share of the vote, they made significant gains at the expense of Labour. The night was a disaster for the Labour Party; their share of the vote fell by over 9%, which meant they were only 700,000 votes ahead of the newly-formed third party, the SDP–Liberal Alliance. The massive increase of support for the Alliance at the expense of Labour meant that, in many seats, the collapse in the Labour vote allowed the Conservatives to gain. Despite winning over 25% of the national vote, the Alliance got fewer than 4% of seats, 186 fewer than Labour. The most significant Labour loss of the night was Tony Benn, who was defeated in the revived Bristol East seat. SDP President Shirley Williams, then a prominent leader in the Social Democratic Party, lost her Crosby seat which she had won in a by-election in 1981. Bill Rodgers, another leading figure in the Alliance (like Williams, one of the "Gang of Four") also failed to win his old seat that he previously held as a Labour MP.
In Scotland, both Labour and the Tories sustained modest losses to the Alliance. Labour remained by far the largest party, with 41 seats to 21 for the Scottish Conservatives. The Scottish Conservatives have been unable to match their 1983 Westminster seat total since, although they did record a slightly larger share of the Scottish vote in 2017, by which time the Scottish National Party had become the dominant party in Scotland with the Tories being the largest unionist party.
On a UK-wide basis, the 1983 election was the worst result in Labour's modern history until the 2019 election. The 1983 result remains the worst-ever modern performance for Labour in England.
| 397 | 209 | 23 | 21 |
| Conservative | Labour | Alliance | O |
| Candidates | Votes | ||||||||||
|---|---|---|---|---|---|---|---|---|---|---|---|
| Party | Leader | Stood | Elected | Gained | Unseated | Net | % of total | % | No. | Net % | |
| Conservative | Margaret Thatcher | 633 | 397 | 47 | 10 | +37 | 61.1 | 42.4 | 13,012,316 | −1.5 | |
| Labour | Michael Foot | 633 | 209 | 4 | 55 | −51 | 32.2 | 27.6 | 8,456,934 | −9.3 | |
| Alliance | David Steel & Roy Jenkins | 636[lower-alpha 3] | 23 | 12 | 0 | +12 | 4.5 | 25.4 | 7,794,770 | +11.6 | |
| SNP | Gordon Wilson | 72 | 2 | 0 | 0 | 0 | 0.3 | 1.1 | 331,975 | −0.5 | |
| UUP | James Molyneaux | 16 | 11 | 3 | 1 | +2 | 1.7 | 0.8 | 259,952 | 0.0 | |
| DUP | Ian Paisley | 14 | 3 | 2 | 1 | +1 | 0.5 | 0.5 | 152,749 | +0.3 | |
| SDLP | John Hume | 17 | 1 | 0 | 1 | −1 | 0.2 | 0.4 | 137,012 | 0.0 | |
| Plaid Cymru | Dafydd Wigley | 38 | 2 | 0 | 0 | 0 | 0.3 | 0.4 | 125,309 | 0.0 | |
| Sinn Féin | Ruairí Ó Brádaigh | 14 | 1 | 1 | 1 | 0 | 0.2 | 0.3 | 102,701 | N/A | |
| Alliance | Oliver Napier | 12 | 0 | 0 | 0 | 0 | 0.0 | 0.2 | 61,275 | −0.1 | |
| Ecology | Jonathon Porritt | 109 | 0 | 0 | 0 | 0 | 0.0 | 0.2 | 54,299 | +0.1 | |
| Independent | N/A | 73 | 0 | 0 | 0 | 0 | 0.0 | 0.1 | 30,422 | N/A | |
| National Front | Andrew Brons | 60 | 0 | 0 | 0 | 0 | 0.0 | 0.1 | 27,065 | −0.5 | |
| UPUP | James Kilfedder | 1 | 1 | 1 | 0 | +1 | 0.2 | 0.1 | 22,861 | N/A | |
| Independent Labour | N/A | 8 | 0 | 0 | 0 | 0 | 0.0 | 0.1 | 16,447 | 0.0 | |
| Workers' Party | Tomás Mac Giolla | 14 | 0 | 0 | 0 | 0 | 0.0 | 0.0 | 14,650 | −0.1 | |
| BNP | John Tyndall | 54 | 0 | 0 | 0 | 0 | 0.0 | 0.0 | 14,621 | N/A | |
| Communist | Gordon McLennan | 35 | 0 | 0 | 0 | 0 | 0.0 | 0.0 | 11,606 | −0.1 | |
| Independent Socialist | N/A | 1 | 0 | 0 | 0 | 0 | 0.0 | 0.0 | 10,326 | N/A | |
| Ind. Conservative | N/A | 10 | 0 | 0 | 0 | 0 | 0.0 | 0.0 | 9,442 | 0.0 | |
| Independent Communist | N/A | 2 | 0 | 0 | 0 | 0 | 0.0 | 0.0 | 4,760 | N/A | |
| Workers Revolutionary | Michael Banda | 21 | 0 | 0 | 0 | 0 | 0.0 | 0.0 | 3,798 | −0.1 | |
| Monster Raving Loony | Screaming Lord Sutch | 11 | 0 | 0 | 0 | 0 | 0.0 | 0.0 | 3,015 | N/A | |
| Wessex Regionalist | N/A | 10 | 0 | 0 | 0 | 0 | 0.0 | 0.0 | 1,750 | 0.0 | |
| Mebyon Kernow | Richard Jenkin | 2 | 0 | 0 | 0 | 0 | 0.0 | 0.0 | 1,151 | N/A | |
| Independent DUP | N/A | 1 | 0 | 0 | 0 | 0 | 0.0 | 0.0 | 1,134 | N/A | |
| Licensees | N/A | 4 | 0 | 0 | 0 | 0 | 0.0 | 0.0 | 934 | N/A | |
| Nationalist Party | N/A | 5 | 0 | 0 | 0 | 0 | 0.0 | 0.0 | 874 | N/A | |
| Labour and Trade Union | Peter Hadden | 1 | 0 | 0 | 0 | 0 | 0.0 | 0.0 | 584 | N/A | |
| Revolutionary Communist | Frank Furedi | 4 | 0 | 0 | 0 | 0 | 0.0 | 0.0 | 581 | N/A | |
| Freedom Party | N/A | 1 | 0 | 0 | 0 | 0 | 0.0 | 0.0 | 508 | N/A | |
| Government's new majority | 144 |
| Total votes cast | 30,671,137 |
| Turnout | 72.7% |
Votes summary
Seats summary
- Conservative
- Labour
- Alliance
- Others
Incumbents defeated
Tables of target seats
Conservative targets
Labour targets
To regain an overall majority, Labour needed to make at least 65 gains.
SDP–Liberal Alliance targets
See also
Notes
- Results for the Liberals only. The SDP did not contest
- Includes boundary change—so this is a nominal figure.
- Includes official Liberal candidates who were not given national Alliance endorsement in three constituencies: Liverpool Broadgreen, Hackney South and Shoreditch, and Hammersmith.
- The SDP–Liberal Alliance vote is compared with the Liberal Party vote in the 1979 election.
- The Independent Unionist elected in the 1979 election defended and held his seat for the Ulster Popular Unionist Party. The United Ulster Unionist Party dissolved and its sole MP did not re-stand.
- The Independent Republican elected in the 1979 election died in 1981. In the ensuring by-election the seat was won by Bobby Sands, an Anti-H-Block/Armagh Political Prisoner who then died and was succeeded by an Anti-H-Block Proxy Political Prisoner candidate Owen Carron. He defended and lost his seat standing for Sinn Féin who contested seats in Northern Ireland for the first time since 1959.
- This election was fought under revised boundaries. The changes reflect those comparing to the notional results on the new boundaries. One significant change was the increase in the number of seats allocated to Northern Ireland from 12 to 17.
- Benn did not serve during his Viscountcy between 1961 and 1963.
References
- "Baroness Margaret Thatcher", gov.uk, retrieved 2 July 2018
- 1983: Thatcher triumphs again, BBC News, 5 April 2005, retrieved 22 March 2015
- Vaidyanathan, Rajini (4 March 2010), Michael Foot: What did the 'longest suicide note' say?, BBC News, retrieved 22 March 2015
- Election 1983 – Part 1 on YouTube
- Julian Haviland (1983). "The June 1983 Election Campaign:Conservative lead was never challenged". The Times Guide to the House of Commons June 1983. London: Times Books Ltd. p. 23. ISBN 0-7230-0255-X.
- Parkhouse, Geoffrey (27 April 1983). "Go for June election, agents urge Thatcher". The Glasgow Herald. p. 1. Retrieved 11 July 2020.
- White, Michael (11 April 2005), "Michael White on 35 years of covering elections", The Guardian, retrieved 23 June 2018
Further reading
- Butler, David E.; et al. (1984), The British General Election of 1983, the standard scholarly study
- Craig, F. W. S. (1989), British Electoral Facts: 1832–1987, Dartmouth: Gower, ISBN 0900178302
- Clarke, Harold D.; Mishler, William; Whiteley, Paul (1990), "Recapturing the Falklands: models of Conservative popularity, 1979–83", British Journal of Political Science, 20 (1): 63–81, doi:10.1017/S0007123400005706
Manifestos
- The Challenge of Our Times, 1983 Conservative Party manifesto
- The New Hope for Britain, 1983 Labour Party manifesto
- Working Together for Britain, 1983 SDP–Liberal Alliance manifesto
| General elections |
|
|---|---|
| Local elections |
|
| European elections | |
| Referendums | |