Mid Bedfordshire (UK Parliament constituency)
Mid Bedfordshire is a constituency[n 1] represented in the House of Commons of the UK Parliament since 2005 by Nadine Dorries, of the Conservative Party.[n 2] Apart from four early years, the constituency has returned a Conservative since its creation in 1918.
| Mid Bedfordshire | |
|---|---|
| County constituency for the House of Commons | |
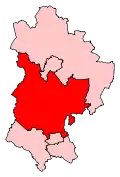 Boundary of Mid Bedfordshire in Bedfordshire | |
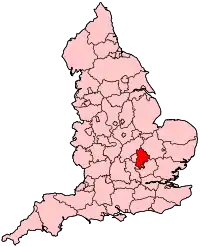 Location of Bedfordshire within England | |
| County | Bedfordshire |
| Electorate | 84,212 (2018)[1] |
| Major settlements | Ampthill, Flitwick |
| Current constituency | |
| Created | 1918 |
| Member of Parliament | Nadine Dorries (Conservative) |
| Number of members | One |
| Created from | Luton and Biggleswade |
History
Mid Bedfordshire was created under the Representation of the People Act 1918.
It has elected Conservative MPs since 1931. It was held from 1983 to 1997 by the Attorney General (for the English, Welsh and Northern Irish aspects of the legal system and as advisor to HM Government) Sir Nicholas Lyell, who then transferred to the newly created seat of North East Bedfordshire; his old seat was won by Jonathan Sayeed, a former MP in Bristol. Sayeed was forced to retire in 2005 due to ill health, following a row over allegations he had profited from his private educational tours of Parliament and a resulting deselection attempt by the constituency party. Nadine Dorries has held the seat since, but the Conservative whip was withdrawn from her in 2012 and returned six months later, after appearing on I'm a Celebrity...Get Me Out of Here!.[2] For the 2005 and 2010 elections the most successful opposition party candidate was a Liberal Democrat. However following their nationwide retreat in 2015, Labour once more occupies this position.
Boundaries and boundary changes
1918–1950: The constituency was created as a Division of Bedfordshire by the Representation of the People Act 1918, comprising the Urban Districts of Ampthill, Biggleswade, and Leighton Buzzard, and the Rural Districts of Ampthill, Biggleswade, and Eaton Bray.[3]
Ampthill and Biggleswade had been part of the abolished Biggleswade Division, and Leighton Buzzard was transferred from the Luton Division.
1950–1974: The Urban Districts of Ampthill, Biggleswade, and Sandy1, the Rural Districts of Ampthill and Biggleswade, and part of the Rural District of Bedford.[3]
1Created as an Urban District from the Rural District of Biggleswade in 1927.[4]
Gained southern and eastern rural areas of the County Constituency of Bedford. Leighton Buzzard and surrounding rural areas (equivalent to the abolished Rural District of Eaton Bray, which had been absorbed by the Rural District of Luton) transferred to the new County Constituency of South Bedfordshire.
1974–1983: As above, apart from changes to the Rural District of Bedford.[3]
The village of Eaton Socon had been absorbed by the Urban District of St Neots in Huntingdonshire and was transferred to the County Constituency thereof.
1983–1997: The District of Mid Bedfordshire wards of Ampthill, Arlesey, Biggleswade Ivel, Biggleswade Stratton, Blunham, Campton and Meppershall, Clifton and Henlow, Clophill, Haynes and Houghton Conquest, Langford, Maulden, Northill, Old Warden and Southill, Potton, Sandy All Saints, Sandy St Swithun's, Shefford, Shillington and Stondon, Stotfold, Wensley, and Wrest, and the Borough of North Bedfordshire wards of Eastcotts, Great Barford, Kempston East, Kempston Rural, Kempston West, Wilshamstead, and Wootton.[5]
Kempston transferred from the abolished County Constituency of Bedford. Parts included in the new County Constituencies of North Bedfordshire (far north-eastern area), South West Bedfordshire (south-western parts) and North Luton (including Flitwick).
1997–2010: The Borough of Bedford wards of Kempston Rural, Wilshamstead, and Wootton; the District of Mid Bedfordshire wards of Ampthill, Aspley Guise, Campton and Meppershall, Cranfield, Clifton and Henlow, Clophill, Flitton and Pulloxhill, Flitwick East, Flitwick West, Harlington, Haynes and Houghton Conquest, Marston, Maulden, Shefford, Shillington and Stondon, Westoning, Woburn, and Wrest; and the District of South Bedfordshire wards of Barton-le-Clay, Streatley, and Toddington.[6]
Wholesale changes, with eastern parts, comprising about half of the electorate, including Biggleswade and Sandy, being transferred to the new County Constituency of North East Bedfordshire. Kempston was transferred back to the re-established Borough Constituency of Bedford. Regained parts of the District of Mid Bedfordshire previously transferred to South West Bedfordshire and North Luton (including Flitwick), together with the parts of the District of South Bedfordshire previously in North Luton.
2010–present: The Borough of Bedford wards of Turvey, Wilshamstead, and Wootton; the District of Mid Bedfordshire wards of Ampthill, Aspley Guise, Clifton and Meppershall, Cranfield, Flitton, Greenfield and Pulloxhill, Flitwick East, Flitwick West, Harlington, Houghton, Haynes, Southill and Old Warden, Marston, Maulden and Clophill, Shefford, Campton and Gravenhurst, Shillington, Stondon and Henlow Camp, Silsoe, Westoning and Tingrith, and Woburn; and the District of South Bedfordshire wards of Barton-le-Clay, Streatley, and Toddington.[7]
Marginal changes due to revision of local authority wards.
Members of Parliament
Elections
Elections in the 2010s
| Party | Candidate | Votes | % | ±% | |
|---|---|---|---|---|---|
| Conservative | Nadine Dorries | 38,692 | 59.8 | -1.9 | |
| Labour | Rhiannon Meades | 14,028 | 21.7 | -6.8 | |
| Liberal Democrats | Rachel McGann | 8,171 | 12.6 | +6.6 | |
| Green | Gareth Ellis | 2,478 | 3.8 | +1.0 | |
| Independent | Alan Victor | 812 | 1.3 | +1.3 | |
| Monster Raving Loony | Ann Kelly | 536 | 0.8 | -0.2 | |
| Majority | 24,664 | 38.1 | +4.9 | ||
| Turnout | 64,717 | 73.7 | -1.3 | ||
| Conservative hold | Swing | +2.4 | |||
| Party | Candidate | Votes | % | ±% | |
|---|---|---|---|---|---|
| Conservative | Nadine Dorries | 38,936 | 61.6 | +5.6 | |
| Labour | Rhianon Meades | 17,953 | 28.4 | +12.6 | |
| Liberal Democrats | Lisa French | 3,798 | 6.0 | -1.2 | |
| Green | Gareth Ellis | 1,794 | 2.8 | -1.4 | |
| Monster Raving Loony | Ann Kelly | 667 | 1.1 | +0.6 | |
| Majority | 20,983 | 33.2 | -6.9 | ||
| Turnout | 63,148 | 76.7 | +5.1 | ||
| Conservative hold | Swing | -3.5 | |||
| Party | Candidate | Votes | % | ±% | |
|---|---|---|---|---|---|
| Conservative | Nadine Dorries | 32,544 | 56.1 | +3.6 | |
| Labour | Charlynne Pullen | 9,217 | 15.9 | +1.1 | |
| UKIP | Nigel Wickens | 8,966 | 15.4 | +10.3 | |
| Liberal Democrats | Linda Jack | 4,193 | 7.2 | -17.7 | |
| Green | Gareth Ellis | 2,462 | 4.2 | +2.8 | |
| Independent | Tim Ireland | 384 | 0.7 | N/A | |
| Monster Raving Loony | Ann Kelly | 294 | 0.5 | N/A | |
| Majority | 23,327 | 40.2 | +12.6 | ||
| Turnout | 58,060 | 71.6 | -0.6 | ||
| Conservative hold | Swing | +1.3 | |||
In June 2015 the independent candidate, Tim Ireland, lodged an unsuccessful election petition accusing Nadine Dorries of breaches of section 106 of the Representation of the People Act 1983 by making false statements about his character.[23][24] The petition was dismissed by the courts on 30 July 2015.[25]
| Party | Candidate | Votes | % | ±% | |
|---|---|---|---|---|---|
| Conservative | Nadine Dorries | 28,815 | 52.5 | +5.9 | |
| Liberal Democrats | Linda Jack | 13,663 | 24.9 | +1.4 | |
| Labour | David Reeves | 8,108 | 14.8 | -7.7 | |
| UKIP | Bill Hall | 2,826 | 5.1 | +2.4 | |
| Green | Malcolm Bailey | 773 | 1.4 | -1.2 | |
| English Democrat | John Cooper | 712 | 1.3 | N/A | |
| Majority | 15,152 | 27.6 | +5.1 | ||
| Turnout | 54,897 | 72.2 | +3.5 | ||
| Conservative hold | Swing | +2.3 | |||
Elections in the 2000s
| Party | Candidate | Votes | % | ±% | |
|---|---|---|---|---|---|
| Conservative | Nadine Dorries | 23,345 | 46.3 | −1.1 | |
| Liberal Democrats | Mark Chapman | 11,990 | 23.8 | +4.1 | |
| Labour | Martin Lindsay | 11,351 | 22.5 | −7.6 | |
| UKIP | Richard Joselyn | 1,372 | 2.7 | 0.0 | |
| Green | Ben Foley | 1,292 | 2.6 | N/A | |
| Veritas | Howard Martin | 769 | 1.5 | N/A | |
| Independent | Saqhib Ali | 301 | 0.6 | N/A | |
| Majority | 11,355 | 22.5 | +5.2 | ||
| Turnout | 50,420 | 68.3 | +2.4 | ||
| Conservative hold | Swing | −2.6 | |||
| Party | Candidate | Votes | % | ±% | |
|---|---|---|---|---|---|
| Conservative | Jonathan Sayeed | 22,109 | 47.4 | +1.4 | |
| Labour | James Valentine | 14,043 | 30.1 | −2.4 | |
| Liberal Democrats | Graham Mabbutt | 9,205 | 19.7 | +2.9 | |
| UKIP | Chris Laurence | 1,281 | 2.7 | N/A | |
| Majority | 8,066 | 17.3 | +3.8 | ||
| Turnout | 46,638 | 65.9 | −13.1 | ||
| Conservative hold | Swing | 1.9 | |||
Elections in the 1990s
| Party | Candidate | Votes | % | ±% | |
|---|---|---|---|---|---|
| Conservative | Jonathan Sayeed | 24,176 | 46.0 | −16.4 | |
| Labour | Neil Mallett | 17,086 | 32.5 | +12.7 | |
| Liberal Democrats | Tim J. Hill | 8,823 | 16.8 | +1.0 | |
| Referendum | Shirley C. Marler | 2,257 | 4.3 | N/A | |
| Natural Law | Marek J. Lorys | 174 | 0.3 | N/A | |
| Majority | 7,090 | 14.0 | -22.4 | ||
| Turnout | 52,534 | 78.9 | -5.5 | ||
| Conservative hold | Swing | -14.6[32] | |||
| Party | Candidate | Votes | % | ±% | |
|---|---|---|---|---|---|
| Conservative | Nicholas Lyell | 40,230 | 58.2 | -0.8 | |
| Labour | Richard A. Clayton | 15,092 | 21.8 | +3.8 | |
| Liberal Democrats | Nikolas Hills | 11,957 | 17.3 | -5.7 | |
| Liberal | Phil Cottier | 1,582 | 2.3 | +2.3 | |
| Natural Law | Marek J. Lorys | 279 | 0.4 | +0.4 | |
| Majority | 25,138 | 36.4 | +0.3 | ||
| Turnout | 69,140 | 84.4 | +5.7 | ||
| Conservative hold | Swing | -2.3 | |||
Elections in the 1980s
| Party | Candidate | Votes | % | ±% | |
|---|---|---|---|---|---|
| Conservative | Nicholas Lyell | 37,411 | 58.98 | ||
| SDP | Nikolas Hills | 14,560 | 22.95 | ||
| Labour | John Heywood | 11,463 | 18.07 | ||
| Majority | 22,851 | 36.02 | |||
| Turnout | 78.63 | ||||
| Conservative hold | Swing | ||||
| Party | Candidate | Votes | % | ±% | |
|---|---|---|---|---|---|
| Conservative | Nicholas Lyell | 33,042 | 56.85 | ||
| Liberal | M. Howes | 15,661 | 26.94 | ||
| Labour | J. Tizard | 9,420 | 16.21 | ||
| Majority | 17,381 | 29.90 | |||
| Turnout | 76.93 | ||||
| Conservative hold | Swing | ||||
Elections in the 1970s
| Party | Candidate | Votes | % | ±% | |
|---|---|---|---|---|---|
| Conservative | Stephen Hastings | 37,724 | 56.87 | ||
| Labour | F.G. Peacock | 17,140 | 25.84 | ||
| Liberal | C.A.P. Smout | 11,467 | 17.29 | ||
| Majority | 20,584 | 31.03 | |||
| Turnout | 81.32 | ||||
| Conservative hold | Swing | ||||
| Party | Candidate | Votes | % | ±% | |
|---|---|---|---|---|---|
| Conservative | Stephen Hastings | 26,885 | 45.70 | ||
| Labour | J.E. Crow | 17,559 | 29.85 | ||
| Liberal | P.W. Meyer | 14,388 | 24.46 | ||
| Majority | 9,326 | 15.85 | |||
| Turnout | 78.26 | ||||
| Conservative hold | Swing | ||||
| Party | Candidate | Votes | % | ±% | |
|---|---|---|---|---|---|
| Conservative | Stephen Hastings | 28,973 | 45.28 | ||
| Labour | David F. Harrowell | 17,862 | 27.92 | ||
| Liberal | P.W. Meyer | 17,151 | 26.80 | ||
| Majority | 11,111 | 17.36 | |||
| Turnout | 85.87 | ||||
| Conservative hold | Swing | ||||
| Party | Candidate | Votes | % | ±% | |
|---|---|---|---|---|---|
| Conservative | Stephen Hastings | 29,670 | 52.51 | ||
| Labour | David F Harrowell | 19,035 | 33.69 | ||
| Liberal | John P. Christian | 7,799 | 13.80 | ||
| Majority | 10,635 | 18.82 | |||
| Turnout | 77.28 | ||||
| Conservative hold | Swing | ||||
Elections in the 1960s
| Party | Candidate | Votes | % | ±% | |
|---|---|---|---|---|---|
| Conservative | Stephen Hastings | 23,477 | 46.02 | ||
| Labour | C. Trevor Bell | 20,369 | 39.98 | ||
| Liberal | Paul L. Rose | 7,138 | 14.01 | ||
| Majority | 3,078 | 6.04 | |||
| Turnout | 82.29 | ||||
| Conservative hold | Swing | ||||
| Party | Candidate | Votes | % | ±% | |
|---|---|---|---|---|---|
| Conservative | Stephen Hastings | 22,414 | 46.03 | ||
| Labour | C. Trevor Bell | 17,096 | 35.11 | ||
| Liberal | Wilfred G. Matthews | 9,184 | 18.86 | ||
| Majority | 5,318 | 10.92 | |||
| Turnout | 48,694 | 83.04 | |||
| Conservative hold | Swing | ||||
| Party | Candidate | Votes | % | ±% | |
|---|---|---|---|---|---|
| Conservative | Stephen Hastings | 17,503 | 45.38 | -1.41 | |
| Labour | Bryan Magee | 11,281 | 29.25 | -6.17 | |
| Liberal | Wilfred G. Matthews | 9,550 | 24.76 | +6.97 | |
| New Conservative | C. F. H. Gilliard | 235 | 0.61 | N/A | |
| Majority | 6,222 | 16.13 | +4.77 | ||
| Turnout | 38,569 | 71.1 | |||
| Conservative hold | Swing | ||||
Elections in the 1950s
| Party | Candidate | Votes | % | ±% | |
|---|---|---|---|---|---|
| Conservative | Alan Lennox-Boyd | 21,301 | 46.79 | ||
| Labour | Bryan Magee | 16,127 | 35.42 | ||
| Liberal | Wilfred G. Matthews | 8,099 | 17.79 | n/a | |
| Majority | 5,174 | 11.36 | |||
| Turnout | 84.48 | ||||
| Conservative hold | Swing | ||||
| Party | Candidate | Votes | % | ±% | |
|---|---|---|---|---|---|
| Conservative | Alan Lennox-Boyd | 23,012 | 54.71 | ||
| Labour | Thomas Skeffington-Lodge | 19,048 | 45.29 | ||
| Majority | 3,964 | 9.42 | |||
| Turnout | 81.36 | ||||
| Conservative hold | Swing | ||||
| Party | Candidate | Votes | % | ±% | |
|---|---|---|---|---|---|
| Conservative | Alan Lennox-Boyd | 19,681 | 45.39 | ||
| Labour | T.L. 'Addy' Taylor | 17,818 | 41.09 | ||
| Liberal | Donald Tweddle | 5,863 | 13.52 | ||
| Majority | 1,863 | 4.30 | |||
| Turnout | 85.34 | ||||
| Conservative hold | Swing | ||||
| Party | Candidate | Votes | % | ±% | |
|---|---|---|---|---|---|
| Conservative | Alan Lennox-Boyd | 17,671 | 41.39 | ||
| Labour | W. Howell | 15,512 | 36.33 | ||
| Liberal | Ewart Kenneth Martell | 9,511 | 22.28 | ||
| Majority | 2,159 | 5.06 | |||
| Turnout | 86.22 | ||||
| Conservative hold | Swing | ||||
Elections in the 1940s
| Party | Candidate | Votes | % | ±% | |
|---|---|---|---|---|---|
| Conservative | Alan Lennox-Boyd | 13,954 | 37.0 | ||
| Labour | W Howell | 12,073 | 32.1 | ||
| Liberal | Ewart Kenneth Martell | 11,641 | 30.9 | ||
| Majority | 1,881 | 5.0 | |||
| Turnout | 37,668 | 73.19 | |||
| Conservative hold | Swing | ||||
General Election 1939/40: Another General Election was required to take place before the end of 1940. The political parties had been making preparations for an election to take place from 1939 and by the end of this year, the following candidates had been selected;
- Conservative: Alan Lennox-Boyd
- Labour: George Matthews
- Liberal: Dr Leonard T M Gray
Election in the 1930s
| Party | Candidate | Votes | % | ±% | |
|---|---|---|---|---|---|
| Conservative | Alan Lennox-Boyd | 16,054 | 50.3 | +2.9 | |
| Liberal | Milner Gray | 11,623 | 36.4 | -6.4 | |
| Labour | Thomas Henry Knight | 4,224 | 13.2 | +3.4 | |
| Majority | 4,431 | 13.89 | |||
| Turnout | 76.29 | ||||
| Conservative hold | Swing | ||||
| Party | Candidate | Votes | % | ±% | |
|---|---|---|---|---|---|
| Conservative | Alan Lennox-Boyd | 15,213 | 47.4 | ||
| Liberal | Milner Gray | 13,726 | 42.8 | ||
| Labour | Henry William Fenner | 3,156 | 9.8 | ||
| Majority | 1,487 | 4.63 | |||
| Turnout | 79.14 | ||||
| Conservative gain from Liberal | Swing | ||||
Election in the 1920s
| Party | Candidate | Votes | % | ±% | |
|---|---|---|---|---|---|
| Liberal | Milner Gray | 14,595 | 46.9 | -1.1 | |
| Unionist | William Warner | 12,682 | 40.7 | -11.2 | |
| Labour | Henry William Fenner | 3,853 | 12.4 | n/a | |
| Majority | 1,913 | 6.2 | 10.1 | ||
| Turnout | 8,829 | ||||
| Liberal gain from Unionist | Swing | +5.1 | |||
| Party | Candidate | Votes | % | ±% | |
|---|---|---|---|---|---|
| Unionist | William Warner | 12,317 | 52.0 | ||
| Liberal | Frederick Linfield | 11,356 | 48.0 | ||
| Majority | 961 | 4.0 | |||
| Turnout | 76.5 | ||||
| Unionist gain from Liberal | Swing | ||||
| Party | Candidate | Votes | % | ±% | |
|---|---|---|---|---|---|
| Liberal | Frederick Linfield | 11,310 | 51.0 | ||
| Unionist | William Warner | 9,287 | 41.9 | ||
| Labour | Robert Leonard Wigzell | 1,567 | 7.1 | n/a | |
| Majority | 2,023 | 9.1 | -3.9 | ||
| Turnout | 72.6 | ||||
| Liberal hold | Swing | ||||
| Party | Candidate | Votes | % | ±% | |
|---|---|---|---|---|---|
| Liberal | Frederick Linfield | 11,874 | 56.5 | +11.7 | |
| Unionist | Max Townley | 9,137 | 43.5 | ||
| Majority | 2,737 | 13.0 | |||
| Turnout | 70.1 | +15.3 | |||
| Liberal gain from Unionist | Swing | +11.7 | |||
Election in the 1910s
| Party | Candidate | Votes | % | ±% | |
|---|---|---|---|---|---|
| C | Unionist | Max Townley | 9,073 | 55.2 | n/a |
| Liberal | Arthur Black | 7,352 | 44.8 | n/a | |
| Majority | 1,721 | 10.4 | n/a | ||
| Turnout | 54.8 | n/a | |||
| Unionist win (new seat) | |||||
| C indicates candidate endorsed by the coalition government. | |||||
Notes and references
- Notes
- A county constituency (for the purposes of election expenses and type of returning officer)
- As with all constituencies, the constituency elects one Member of Parliament (MP) by the first past the post system of election at least every five years.
- References
- "England Parliamentary electorates 2010-2018". Boundary Commission for England. Retrieved 23 March 2019.
- Nadine Dorries suspended as Tory MP in I'm a Celebrity row, 6 November 2012
- Craig, F. W. S. (1972). Boundaries of Parliamentary Constituencies 1885-1972. Chichester: Political Reference Publications. ISBN 0-900178-09-4.
- "Sandy UD through time | Census tables with data for the Local Government District". www.visionofbritain.org.uk. Retrieved 28 January 2019.
- "The Parliamentary Constituencies (England) Order 1983". www.legislation.gov.uk. Retrieved 28 January 2019.
- "The Parliamentary Constituencies (England) Order 1995". www.legislation.gov.uk. Retrieved 28 January 2019.
- "The Parliamentary Constituencies (England) Order 2007". www.legislation.gov.uk. Retrieved 28 January 2019.
- Leigh Rayment's Historical List of MPs – Constituencies beginning with "B" (part 2)
- "Bedfordshire Mid Parliamentary constituency". BBC News. BBC. Retrieved 19 November 2019.
- "General election: 8 June, 2017, Results of the 2017 general election for Central Bedfordshire", www.centralbedfordshire.gov.uk, retrieved 28 November 2017
- Kirk, Ashley (8 June 2017), "General Election 2017: Full results, Constituency finder: Bedfordshire Mid", The Telegraph, retrieved 28 November 2017
- Bloom, Dan (7 June 2017), "General election candidates 2017: Full list of who is standing in all 650 seats in plain text format", Daily Mirror
- "Statement of persons nominated, notice of poll and situation of polling stations for Mid Bedfordshire" (PDF), www.centralbedfordshire.gov.uk, Richard Carr, acting returning officer, 8 May 2017, retrieved 19 May 2017
- "Notice of election agents for Mid Bedfordshire" (PDF), www.centralbedfordshire.gov.uk, Richard Carr, acting returning officer, 8 May 2017, retrieved 19 May 2017
- "Election Data 2015". Electoral Calculus. Archived from the original on 17 October 2015. Retrieved 17 October 2015.
- "Statement Of Persons Nominated And Notice Of Poll" (PDF). Acting Returning Officer. 9 April 2015. Archived from the original (PDF) on 23 September 2015. Retrieved 14 April 2015.
- "UK ELECTION RESULTS: BEDFORDSHIRE MID 2015".
- "nigelwickens.wordpress.com". Archived from the original on 2 February 2015. Retrieved 1 February 2015.
- "Central Bedfordshire Liberal Democrats". www.facebook.com.
- "Gareth Ellis selected as Green Party candidate for Mid Bedfordshire". 31 July 2019.
- "Tim Ireland: Prospective Independent Parliamentary Candidate for Mid Bedfordshire". 26 July 2010. Retrieved 18 March 2015.
- "Candidates". OMRLP. 19 February 2015. Retrieved 19 March 2015.
- Perraudin, Frances (10 June 2015). "Nadine Dorries accused of making false claims about opponent during election". The Guardian. Retrieved 10 June 2015.
- Green, Chris (10 June 2015). "Nadine Dorries faces challenge after general election smear campaign allegations". The Independent. Retrieved 10 June 2015.
- Green,Chris (30 July 2015). "High Court rejects attempt to unseat Nadine Dorries after legal documents sent to wrong address". The Independent. London. Retrieved 13 August 2015.
- "Election Data 2010". Electoral Calculus. Archived from the original on 26 July 2013. Retrieved 17 October 2015.
- Archived 25 May 2010 at the Wayback Machine
- "Election Data 2005". Electoral Calculus. Archived from the original on 15 October 2011. Retrieved 18 October 2015.
- "Election Data 2001". Electoral Calculus. Archived from the original on 15 October 2011. Retrieved 18 October 2015.
- "BBC NEWS | VOTE 2001 | RESULTS & CONSTITUENCIES | Bedfordshire Mid". news.bbc.co.uk.
- "Election Data 1997". Electoral Calculus. Archived from the original on 15 October 2011. Retrieved 18 October 2015.
- The swing was calculated by the BBC compared with a notional 1992 result. BBC Election '97
- "Election Data 1992". Electoral Calculus. Archived from the original on 15 October 2011. Retrieved 18 October 2015.
- "Politics Resources". Election 1992. Politics Resources. 9 April 1992. Archived from the original on 24 July 2011. Retrieved 6 December 2010.
- "Election Data 1987". Electoral Calculus. Archived from the original on 15 October 2011. Retrieved 18 October 2015.
- "Election Data 1983". Electoral Calculus. Archived from the original on 15 October 2011. Retrieved 18 October 2015.
- British parliamentary election results 1918-1949, Craig, F.W.S.
- British Parliamentary Election Results 1918-1949, FWS Craig