Community of Metros
The Community of Metros (also called CoMET) is a multinational collection of metro systems focusing on international railway benchmarking, facilitated by the Railway and Transport Strategy Centre (RTSC) at Imperial College London. The CoMET and Nova benchmarking group of metros consist of large metro systems from around the world. Currently, the two consortia are made up of 42 large- and medium-sized metro systems from 39 cities around the world. The groups are jointly owned and steered by the various members.
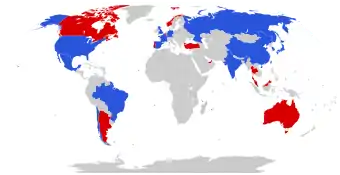
The 19 members of the CoMET are the Beijing Subway, Berlin U-Bahn, Delhi Metro, Guangzhou Metro, Hong Kong Mass Transit Railway, London Underground, Madrid Metro, Mexico City Metro, Moscow Metro, New York City Subway, Paris Métro, Santiago Metro, São Paulo Metro, Seoul Metro, Shanghai Metro, Shenzhen Metro, Singapore Mass Rapid Transit, Taipei Metro, and Tokyo Metro. Each metro system has a volume of at least 500 million passengers annually.[1]
Objectives
The four main objectives of the metro benchmarking groups are:[2]
- To share knowledge and identify best practices in a confidential environment
- To support members in achieving their operational and strategic goals – focusing on improvements
- To build systems of measures for use by management and to establish public transport best practices
- To prioritise areas for improvement and support decision-making for management, boards, government, and other stakeholders
CoMET benchmarking
The key performance indicator (KPI) system is used by the CoMET during the benchmarking process in order to compare performance across the member metro systems. The purpose of benchmarking is to search for best practices that lead to superior performance. There are approximately 30 top-level indicators, which are designed to measure the overall performance of the organisation in six distinct areas:[3]
- Growth, learning, and innovation
- Financial
- Customer
- Internal processes
- Safety and security
- Environment
The indicators are reviewed by members on an annual basis. The CoMET conducts two meetings per year. The group members operate under a full confidentiality agreement. This allows for full data and information exchange within the CoMET but not externally.[4]
Statistical analyses are used to provide greater understanding of the results, while time series analyses allow for trends in performance to be identified. This helps to highlight which members are changing their practices and what improvements are relatively achievable. Where clear differences or improvements in performance are identified, detailed analysis is carried out through case studies.[5] Approximately four to six case studies are conducted in the CoMET and Nova group combined each year; these studies include detailed data analysis, questionnaires, and interviews with functional experts. Case studies are further supported by expert workshops where appropriate. In many cases, best practices may be found outside the metro industry, so other public transport operations and even other industries are reviewed for relevant practices.[6][7]
Major publications
Some of the major publication journals by CoMET and NOVA include:
- Canavan, S., Graham, D.J., Anderson, R.J., Barron, A. (2017). Urban Metro Rail Demand: Evidence from Dynamic Generalised Method of Moments (GMM) Estimates using Panel Data
- Hörcher, D., Graham, D. J., and Anderson, R. J. (2017). Crowding cost estimation with large scale smart card and vehicle location data. TRANSPORTATION RESEARCH PART B: METHODOLOGICAL, 95, 105-125.
- Singh, R., Graham, D.J., Anderson, R. (2017) Characterising journey time performance on urban metro systems. TransitData conference, Santiago, Chile, 22 May 2017.
- Hörcher,D., Graham,D.J., Anderson,R., (2017) Crowding cost estimation with large scale smart card and vehicle location data, Transportation Research Part B: Methodological, pp. 105-125
- Brage-Ardao, R., Graham, D.J., Anderson, R.J., Barron, A. (2017). Metro Operating Costs: Main Patterns and Determinants. Transportation Research Board 96th Annual Meeting, Washington DC
References
- "Background". Community of Metros. Community of Metros. Retrieved 5 April 2020.
- "Benchmarking". CoMET and Nova Metro Benchmarking. Community of Metros. Retrieved 5 April 2020.
- Condry, Ben. "International PublicTransport Benchmarking: Learning from others". Academia. Imperial College London. Retrieved 5 April 2020.
- Anderson, Richard. "Metro Benchmarking Yield Tangible Benefits" (PDF). Imperial College London. Imperial College London. Retrieved 5 April 2020.
- "Rail and Underground Panel" (PDF). Transport for London. Retrieved 5 April 2020.
- "Benchmarking". Community of Metros. Community of Metros. Retrieved 5 April 2020.
- "The Operator's Story Emerging Findings OECD ITF 2017, Leipzig" (PDF). World Bank / Imperial College London. Retrieved 18 April 2020.
External links
Members of international metro organizations | |||||||||||
|---|---|---|---|---|---|---|---|---|---|---|---|
| |||||||||||
| |||||||||||