Connecticut's 1st congressional district
Connecticut's 1st congressional district is a congressional district in the U.S. state of Connecticut. Located in the north-central part of the state, the district is anchored by the state capital of Hartford. It encompasses much of central Connecticut and includes towns within Hartford, Litchfield, and Middlesex counties.
| Connecticut's 1st congressional district | |||
|---|---|---|---|
.tif.png.webp) Connecticut's 1st congressional district – since January 3, 2013. | |||
| Representative |
| ||
| Area | 673 sq mi (1,740 km2) | ||
| Distribution |
| ||
| Population (2019) | 703,138 | ||
| Median household income | $75,502[1] | ||
| Ethnicity |
| ||
| Cook PVI | D+12[2] | ||
Principal cities include: Bristol, Hartford, and Torrington.
The district is currently represented by Democrat John Larson.
Towns in the district
Hartford County – Berlin, Bloomfield, Bristol, East Granby, East Hartford, East Windsor, Glastonbury (part), Granby, Hartford, Hartland, Manchester, Newington, Rocky Hill, Southington, South Windsor, West Hartford, Wethersfield, Windsor, and Windsor Locks.
Litchfield County – Barkhamsted, Colebrook, New Hartford, Torrington (part), and Winchester.
Middlesex County – Cromwell, Middletown (part), and Portland.
Voter registration
| Voter Registration and Party Enrollment as of October 30, 2012[3] | |||||
|---|---|---|---|---|---|
| Party | Active Voters | Inactive Voters | Total Voters | Percentage | |
| Democratic | 156,784 | 11,392 | 168,176 | 40.39% | |
| Republican | 71,932 | 3,348 | 75,280 | 18.08% | |
| Minor Parties | 301 | 29 | 330 | 0.07% | |
| Unaffiliated | 161,327 | 11,299 | 172,626 | 41.46% | |
| Total | 390,334 | 26,068 | 416,412 | 100% | |
Recent presidential elections
| Election results from presidential races | ||
|---|---|---|
| Year | Office | Results |
| 2000 | President | Gore 62–33% |
| 2004 | President | Kerry 60–39% |
| 2008 | President | Obama 66–33% |
| 2012 | President | Obama 63–36% |
| 2016 | President | Clinton 59–36% |
| 2020 | President | Biden 63–35% |
Recent elections
The district has the lowest Republican voter performance of the five Connecticut house seats. It has been in Democratic hands without interruption since 1957, and for all but six years since 1931.
| Party | Candidate | Votes | % | ±% | |
|---|---|---|---|---|---|
| Democratic | Barbara B. Kennelly (inc.) | 176,463 | 77% | ||
| Republican | Mario Robles, Jr. | 51,985 | 23% | ||
| Democratic hold | Swing | ||||
| Turnout | 228,448 | 100% | |||
| Party | Candidate | Votes | % | ±% | |
|---|---|---|---|---|---|
| Democratic | Barbara B. Kennelly (inc.) | 126,566 | 71% | ||
| Republican | James P. Garvey | 50,690 | 29% | ||
| Democratic hold | Swing | ||||
| Turnout | 177,256 | 100% | |||
| Party | Candidate | Votes | % | ±% | |
|---|---|---|---|---|---|
| Democratic | Barbara B. Kennelly (inc.) | 164,735 | 67% | ||
| Republican | Phillip Steele | 75,113 | 31% | ||
| Concerned Citizens | Gary Garneau | 5,577 | 2% | ||
| Democratic hold | Swing | ||||
| Turnout | 245,425 | 100% | |||
| Party | Candidate | Votes | % | ±% | |
|---|---|---|---|---|---|
| Democratic | Barbara B. Kennelly (inc.) | 139,637 | 74% | ||
| Republican | Douglas T. Putnam | 46,865 | 24% | ||
| Concerned Citizens | John F. Forry, III | 3,405 | 2% | ||
| Democratic hold | Swing | ||||
| Turnout | 188,907 | 100% | |||
| Party | Candidate | Votes | % | ±% | |
|---|---|---|---|---|---|
| Democratic | Barbara B. Kennelly (inc.) | 158,222 | 74% | ||
| Republican | Kent Sleath | 53,666 | 24% | ||
| Concerned Citizens | John F. Forry, III | 2,099 | 1% | ||
| Natural Law | Daniel A. Wasielewski | 1,149 | 1% | ||
| Democratic hold | Swing | ||||
| Turnout | 215,136 | 100% | |||
| Party | Candidate | Votes | % | ±% | |
|---|---|---|---|---|---|
| Democratic | John B. Larson | 97,681 | 58% | ||
| Republican | Kevin O'Connor | 69,668 | 41% | ||
| Term Limits | Jay E. Palmieri, IV | 915 | 1% | ||
| Democratic hold | Swing | ||||
| Turnout | 168,264 | 100% | |||
| Party | Candidate | Votes | % | ±% | |
|---|---|---|---|---|---|
| Democratic | John B. Larson (inc.) | 151,932 | 72% | ||
| Republican | Robert Backlund | 59,331 | 28% | ||
| Democratic hold | Swing | ||||
| Turnout | 211,263 | 100% | |||
| Party | Candidate | Votes | % | ±% | |
|---|---|---|---|---|---|
| Democratic | John B. Larson (inc.) | 134,698 | 67% | ||
| Republican | Phil Steele | 66,968 | 33% | ||
| Democratic hold | Swing | ||||
| Turnout | 201,666 | 100% | |||
| Party | Candidate | Votes | % | ±% | |
|---|---|---|---|---|---|
| Democratic | John B. Larson (inc.) | 197,964 | 73% | ||
| Republican | John Halstead | 73,272 | 27% | ||
| Democratic hold | Swing | ||||
| Turnout | 271,237 | 100% | |||
| Party | Candidate | Votes | % | ±% | |
|---|---|---|---|---|---|
| Democratic | John B. Larson (inc.) | 154,539 | 74% | ||
| Republican | Scott MacLean | 53,010 | 26% | ||
| Democratic hold | Swing | ||||
| Turnout | 207,549 | 100% | |||
| Party | Candidate | Votes | % | ±% | |
|---|---|---|---|---|---|
| Democratic | John B. Larson (inc.) | 211,563 | 72% | ||
| Republican | Joe Visconti | 76,851 | 26% | ||
| Green | Stephen Fournier | 7,199 | 2% | ||
| Democratic hold | Swing | ||||
| Turnout | 295,613 | 100% | |||
| Party | Candidate | Votes | % | ±% | |
|---|---|---|---|---|---|
| Democratic | John B. Larson (inc.) | 138,440 | 61% | ||
| Republican | Ann Brickley | 84,076 | 37% | ||
| Green | Kenneth J. Krayeske | 2,564 | 1% | ||
| Socialist Action | Christopher Hutchinson | 955 | 0.42% | ||
| Democratic hold | Swing | ||||
| Turnout | 226,035 | 100% | |||
| Party | Candidate | Votes | % | ±% | |
|---|---|---|---|---|---|
| Democratic | John B. Larson (inc.) | 206,575 | 70% | ||
| Republican | John Henry Decker | 82,262 | 28% | ||
| Green | Michael DeRosa | 5,746 | 2% | ||
| Democratic hold | Swing | ||||
| Turnout | 294,583 | 100% | |||
| Party | Candidate | Votes | % | ±% | |
|---|---|---|---|---|---|
| Democratic | John B. Larson (inc.) | 135,825 | 62% | ||
| Republican | Matthew Corey | 78,609 | 36% | ||
| Green | Jeff Russell | 3,447 | 2% | ||
| Democratic hold | Swing | ||||
| Turnout | 217,881 | 100% | |||
| Party | Candidate | Votes | % | ±% | |
|---|---|---|---|---|---|
| Democratic | John B. Larson (inc.) | 188,286 | 64% | ||
| Republican | Matthew Corey | 100,976 | 34% | ||
| Green | Mike De Rosa | 6,031 | 2% | ||
| Democratic hold | Swing | ||||
| Turnout | 295,293 | 100% | |||
| Party | Candidate | Votes | % | ±% | |
|---|---|---|---|---|---|
| Democratic | John B. Larson (inc.) | 175,087 | 63% | ||
| Republican | Jennifer Nye | 96,024 | 35% | ||
| Green | Tom McCormick | 3,029 | 1% | ||
| Democratic hold | Swing | ||||
| Turnout | 274,140 | 100% | |||
| Party | Candidate | Votes | % | |
|---|---|---|---|---|
| Democratic | John B. Larson (inc.) | 222,668 | 63% | |
| Republican | Mary Fay | 122,111 | 35% | |
| Green | Tom McCormick | 4,458 | 1% | |
| Total votes | 349,237 | 100% | ||
| Democratic hold | ||||
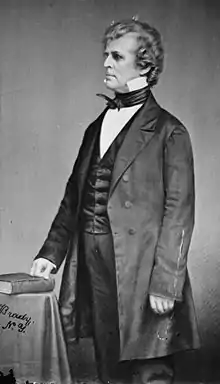
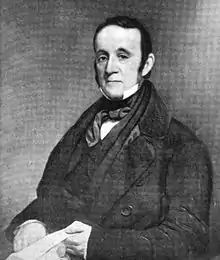
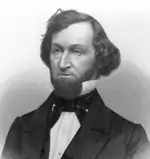
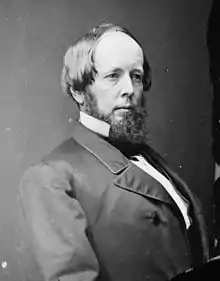
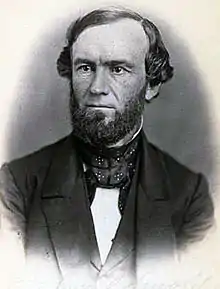
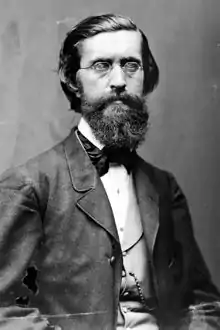
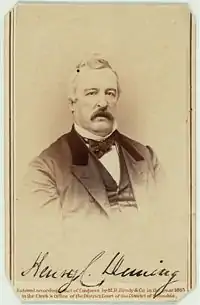
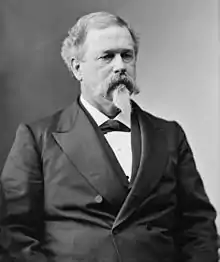
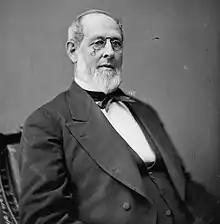
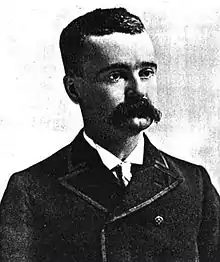
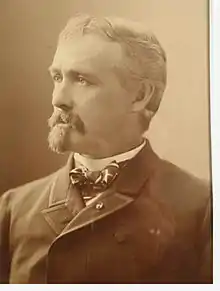
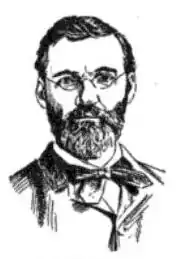
List of members representing the district
.jpg.webp)
.jpg.webp)
.jpg.webp)
.jpg.webp)


.jpg.webp)


.jpg.webp)


References
- https://www.census.gov/mycd/?st=09&cd=01
- "Partisan Voting Index – Districts of the 115th Congress" (PDF). The Cook Political Report. April 7, 2017. Retrieved April 7, 2017.
- "Registration and Party Enrollment Statistics as of October 30, 2012" (PDF). Connecticut Secretary of State. Archived from the original (PDF) on September 23, 2006. Retrieved October 30, 2012.
- Martis, Kenneth C. (1989). The Historical Atlas of Political Parties in the United States Congress. New York: Macmillan Publishing Company.
- Martis, Kenneth C. (1982). The Historical Atlas of United States Congressional Districts. New York: Macmillan Publishing Company.
- Congressional Biographical Directory of the United States 1774–present