Differential scanning calorimetry
Differential scanning calorimetry (DSC) is a thermoanalytical technique in which the difference in the amount of heat required to increase the temperature of a sample and reference is measured as a function of temperature. Both the sample and reference are maintained at nearly the same temperature throughout the experiment. Generally, the temperature program for a DSC analysis is designed such that the sample holder temperature increases linearly as a function of time. The reference sample should have a well-defined heat capacity over the range of temperatures to be scanned.
 Differential scanning calorimeter | |
| Acronym | DSC |
|---|---|
| Classification | Thermal analysis |
| Manufacturers | Mettler Toledo, Shimadzu, PerkinElmer, Malvern Instruments, NETZSCH Gerätebau GmbH |
| Other techniques | |
| Related | Isothermal microcalorimetry Isothermal titration calorimetry Dynamic mechanical analysis Thermomechanical analysis Thermogravimetric analysis Differential thermal analysis Dielectric thermal analysis |
The technique was developed by E. S. Watson and M. J. O'Neill in 1962,[1] and introduced commercially at the 1963 Pittsburgh Conference on Analytical Chemistry and Applied Spectroscopy. The first adiabatic differential scanning calorimeter that could be used in biochemistry was developed by P. L. Privalov and D. R. Monaselidze in 1964 at Institute of Physics in Tbilisi, Georgia.[2] The term DSC was coined to describe this instrument, which measures energy directly and allows precise measurements of heat capacity.[3]
Types of DSC
There are two different types of DSC: Heat-flux DSC in which heat flux remains constant and Power differential DSC in which power supply remains constant.
Heat-flux DSC
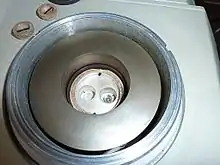
With Heat-flux DSC, the changes in heat flow are calculated by integrating the ΔTref- curve. For this kind of experiment, a sample and a reference crucible are placed on a sample holder with integrated temperature sensors for temperature measurement of the crucibles. This arrangement is located in a temperature-controlled oven. Contrary to this classic design, the distinctive attribute of MC-DSC is the vertical configuration of planar temperature sensors surrounding a planar heater. This arrangement allows a very compact, lightweight and low heat capacitance structure with the full functionality of a DSC oven.[4]
Power differential DSC
For this kind of setup, also known as Power compensating DSC, the sample and reference crucible are placed in thermally insulated furnaces and not next to each other in the same furnace like in Heat-flux-DSC experiments. Then the temperature of both chambers is controlled so that the same temperature is always present on both sides. The electrical power that is required to obtain and remain this state is then recorded instead of the temperature difference of the two crucibles.[5]
Detection of phase transitions
The basic principle underlying this technique is that when the sample undergoes a physical transformation such as phase transitions, more or less heat will need to flow to it than the reference to maintain both at the same temperature. Whether less or more heat must flow to the sample depends on whether the process is exothermic or endothermic. For example, as a solid sample melts to a liquid, it will require more heat flowing to the sample to increase its temperature at the same rate as the reference. This is due to the absorption of heat by the sample as it undergoes the endothermic phase transition from solid to liquid. Likewise, as the sample undergoes exothermic processes (such as crystallization) less heat is required to raise the sample temperature. By observing the difference in heat flow between the sample and reference, differential scanning calorimeters are able to measure the amount of heat absorbed or released during such transitions. DSC may also be used to observe more subtle physical changes, such as glass transitions. It is widely used in industrial settings as a quality control instrument due to its applicability in evaluating sample purity and for studying polymer curing.[6][7][8]
DTA
An alternative technique, which shares much in common with DSC, is differential thermal analysis (DTA). In this technique it is the heat flow to the sample and reference that remains the same rather than the temperature. When the sample and reference are heated identically, phase changes and other thermal processes cause a difference in temperature between the sample and reference. Both DSC and DTA provide similar information. DSC measures the energy required to keep both the reference and the sample at the same temperature whereas DTA measures the difference in temperature between the sample and the reference when the same amount of energy has been introduced into both.
DSC curves

The result of a DSC experiment is a curve of heat flux versus temperature or versus time. There are two different conventions: exothermic reactions in the sample shown with a positive or negative peak, depending on the kind of technology used in the experiment. This curve can be used to calculate enthalpies of transitions. This is done by integrating the peak corresponding to a given transition. It can be shown that the enthalpy of transition can be expressed using the following equation:

where is the enthalpy of transition, is the calorimetric constant, and is the area under the curve. The calorimetric constant will vary from instrument to instrument, and can be determined by analyzing a well-characterized sample with known enthalpies of transition.[7]


Applications
Differential scanning calorimetry can be used to measure a number of characteristic properties of a sample. Using this technique it is possible to observe fusion and crystallization events as well as glass transition temperatures Tg. DSC can also be used to study oxidation, as well as other chemical reactions.[6][7][9]
Glass transitions may occur as the temperature of an amorphous solid is increased. These transitions appear as a step in the baseline of the recorded DSC signal. This is due to the sample undergoing a change in heat capacity; no formal phase change occurs.[6][8]
As the temperature increases, an amorphous solid will become less viscous. At some point the molecules may obtain enough freedom of motion to spontaneously arrange themselves into a crystalline form. This is known as the crystallization temperature (Tc). This transition from amorphous solid to crystalline solid is an exothermic process, and results in a peak in the DSC signal. As the temperature increases the sample eventually reaches its melting temperature (Tm). The melting process results in an endothermic peak in the DSC curve. The ability to determine transition temperatures and enthalpies makes DSC a valuable tool in producing phase diagrams for various chemical systems.[6]
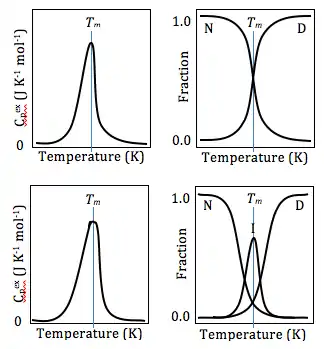
Differential scanning calorimetry can also be used to obtain valuable thermodynamics information about proteins. The thermodynamics analysis of proteins can reveal important information about the global structure of proteins, and protein/ligand interaction. For example, many mutations lower the stability of proteins, while ligand binding usually increases protein stability.[10] Using DSC, this stability can be measured by obtaining Gibbs Free Energy values at any given temperature. This allows researchers to compare the free energy of unfolding between ligand-free protein and protein-ligand complex, or wild type and mutant proteins. DSC can also be used in studying protein/lipid interactions, nucleotides, drug-lipid interactions.[11] In studying protein denaturation using DSC, the thermal melt should be at least to some degree reversible, as the thermodynamics calculations rely on chemical equlibrium.[11]
Examples
The technique is widely used across a range of applications, both as a routine quality test and as a research tool. The equipment is easy to calibrate, using low melting indium at 156.5985 °C for example, and is a rapid and reliable method of thermal analysis.
Polymers
DSC is used widely for examining polymeric materials to determine their thermal transitions. Important thermal transitions include the glass transition temperature (Tg), crystallization temperature (Tc), and melting temperature (Tm). The observed thermal transitions can be utilized to compare materials, although the transitions alone do not uniquely identify composition. The composition of unknown materials may be completed using complementary techniques such as IR spectroscopy. Melting points and glass transition temperatures for most polymers are available from standard compilations, and the method can show polymer degradation by the lowering of the expected melting temperature. Tm depends on the molecular weight of the polymer and thermal history.
The percent crystalline content of a polymer can be estimated from the crystallization/melting peaks of the DSC graph using reference heats of fusion found in the literature.[12] DSC can also be used to study thermal degradation of polymers using an approach such as Oxidative Onset Temperature/Time (OOT); however, the user risks contamination of the DSC cell, which can be problematic. Thermogravimetric Analysis (TGA) may be more useful for decomposition behavior determination. Impurities in polymers can be determined by examining thermograms for anomalous peaks, and plasticisers can be detected at their characteristic boiling points. In addition, examination of minor events in first heat thermal analysis data can be useful as these apparently "anomalous peaks" can in fact also be representative of process or storage thermal history of the material or polymer physical aging. Comparison of first and second heat data collected at consistent heating rates can allow the analyst to learn about both polymer processing history and material properties.
Liquid crystals
DSC is used in the study of liquid crystals. As some forms of matter go from solid to liquid they go through a third state, which displays properties of both phases. This anisotropic liquid is known as a liquid crystalline or mesomorphous state. Using DSC, it is possible to observe the small energy changes that occur as matter transitions from a solid to a liquid crystal and from a liquid crystal to an isotropic liquid.[7]
Oxidative stability
Using differential scanning calorimetry to study the stability to oxidation of samples generally requires an airtight sample chamber. It can be used to determine the oxidative-induction time (OIT) of a sample. Such tests are usually done isothermally (at constant temperature) by changing the atmosphere of the sample. First, the sample is brought to the desired test temperature under an inert atmosphere, usually nitrogen. Then, oxygen is added to the system. Any oxidation that occurs is observed as a deviation in the baseline. Such analysis can be used to determine the stability and optimum storage conditions for a material or compound.[6]
Safety screening
DSC makes a reasonable initial safety screening tool. In this mode the sample will be housed in a non-reactive crucible (often gold or gold-plated steel), and which will be able to withstand pressure (typically up to 100 bar). The presence of an exothermic event can then be used to assess the stability of a substance to heat. However, due to a combination of relatively poor sensitivity, slower than normal scan rates (typically 2–3 °C/min, due to much heavier crucible) and unknown activation energy, it is necessary to deduct about 75–100 °C from the initial start of the observed exotherm to suggest a maximal temperature for the material. A much more accurate data set can be obtained from an adiabatic calorimeter, but such a test may take 2–3 days from ambient at a rate of a 3 °C increment per half-hour.
Drug analysis
DSC is widely used in the pharmaceutical and polymer industries. For the polymer chemist, DSC is a handy tool for studying curing processes, which allows the fine tuning of polymer properties. The cross-linking of polymer molecules that occurs in the curing process is exothermic, resulting in a negative peak in the DSC curve that usually appears soon after the glass transition.[6][7][8]
In the pharmaceutical industry it is necessary to have well-characterized drug compounds in order to define processing parameters. For instance, if it is necessary to deliver a drug in the amorphous form, it is desirable to process the drug at temperatures below those at which crystallization can occur.[7]
General chemical analysis
Freezing-point depression can be used as a purity analysis tool when analysed by differential scanning calorimetry. This is possible because the temperature range over which a mixture of compounds melts is dependent on their relative amounts. Consequently, less pure compounds will exhibit a broadened melting peak that begins at lower temperature than a pure compound.[7][8]
See also
References
- U.S. Patent 3,263,484.
- Molecular biology (in Russian). 6. Moscow. 1975. pp. 7–33.
- Wunderlich B (1990). Thermal Analysis. New York: Academic Press. pp. 137–140. ISBN 0-12-765605-7.
- Missal W, Kita J, Wappler E, Gora F, Kipka A, Bartnitzek T, Bechtold F, Schabbel D, Pawlowski B, Moos R (2010). "Miniaturized Ceramic Differential Scanning Calorimeter with Integrated Oven and Crucible in LTCC Technology". Procedia Engineering 5. Procedia Engineering. 5. Elsevier. pp. 940–943. doi:10.1016/j.proeng.2010.09.263. ISSN 1877-7058.
- Höhne G, Hemminger WF, Flammersheim HJ (2003). Differential Scanning Calorimetry. Springer-Verlag. pp. 17 ff. ISBN 978-3-540-00467-7.
- Dean JA (1995). The Analytical Chemistry Handbook. New York: McGraw Hill, Inc. pp. 15.1–15.5. ISBN 0-07-016197-6.
- Pungor E (1995). A Practical Guide to Instrumental Analysis. Florida: Boca Raton. pp. 181–191.
- Skoog DA, Holler FJ, Nieman T (1998). Principles of Instrumental Analysis (5th ed.). New York. pp. 805–808. ISBN 0-03-002078-6.
- O'Neill MJ (1964). "The Analysis of a Temperature-Controlled Scanning Calorimeter". Anal. Chem. 36 (7): 1238–1245. doi:10.1021/ac60213a020.
- Schön A, Brown RK, Hutchins BM, Freire E (December 2013). "Ligand binding analysis and screening by chemical denaturation shift". Analytical Biochemistry. 443 (1): 52–7. doi:10.1016/j.ab.2013.08.015. PMC 3809086. PMID 23994566.
- Chiu MH, Prenner EJ (January 2011). "Differential scanning calorimetry: An invaluable tool for a detailed thermodynamic characterization of macromolecules and their interactions". Journal of Pharmacy & Bioallied Sciences. 3 (1): 39–59. doi:10.4103/0975-7406.76463. PMC 3053520. PMID 21430954.
- Wunderlich B (1980). "Chapter 8, Table VIII.6". Macromolecular Physics. 3.
Further reading
- Brydson JA (1999). "Chapter 8: Melt Processing of Thermal Plastics". Plastics Materials (7th ed.). Butterworth-Heinemann. p. 161. ISBN 978-0-08-051408-6.
- Ezrin M (1996). Plastics Failure Guide: Cause and Prevention. Hanser-SPE. ISBN 978-1-56990-184-7.
- Wright DC (2001). Environmental Stress Cracking of Plastics. RAPRA. ISBN 978-1-85957-064-7.
- Lewis PR, Gagg C (2010). Katz E, Halámek J (eds.). Forensic Polymer Engineering: Why polymer products fail in service. Woodhead/CRC Press. ISBN 978-3-527-33894-8.