Don Valley (UK Parliament constituency)
Don Valley is a constituency[n 1] in South Yorkshire represented in the House of Commons of the UK Parliament since 2019 by Nick Fletcher of the Conservative Party.[n 2]
| Don Valley | |
|---|---|
| County constituency for the House of Commons | |
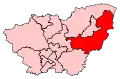 Boundary of Don Valley in South Yorkshire | |
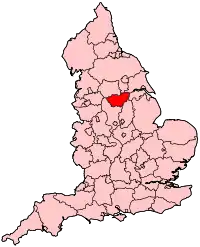 Location of South Yorkshire within England | |
| County | South Yorkshire |
| Electorate | 74,456 (December 2019)[1] |
| Major settlements | Hatfield, Thorne, and Conisbrough. |
| Current constituency | |
| Created | 1918 |
| Member of Parliament | Nick Fletcher (Conservative) |
| Number of members | One |
| Created from | Doncaster |
Constituency profile
Created in 1918, Don Valley is a former coal mining area which elected only Labour MPs from 1922 to 2019. The current MP is Nick Fletcher, elected in 2019.
Boundaries
1918—1950: The Urban Districts of Mexborough and Tickhill, and the Rural Districts of Doncaster and Thorne.
1950—1983: The Urban Districts of Adwick-le-Street, Bentley with Arksey, and Tickhill, and the Rural District of Doncaster.
1983—1997: The Metropolitan Borough of Doncaster wards of Conisbrough, Edlington and Warmsworth, Mexborough, Richmond, Rossington, South East, and Southern Parks.
1997—2010: The Metropolitan Borough of Doncaster wards of Conisbrough, Edlington and Warmsworth, Hatfield, Rossington, South East, and Southern Parks.
2010–present: The Metropolitan Borough of Doncaster wards of Conisbrough and Denaby, Edlington and Warmsworth, Finningley, Hatfield, Rossington, Thorne, and Torne Valley.
The current constituency consists of the southern Borough of Doncaster, from Hatfield and the Humberhead Peatlands Nature Reserve in the north and northeast, through Branton, Auckley, and Rossington, to the Torne Valley electoral ward which consists of Wadworth, Tickhill, Braithwell, and in the west Conisbrough.
In boundary changes which took effect at the 2010 election, Sprotbrough was moved to Doncaster North, while in the east the town of Thorne was moved from Doncaster North into Don Valley.
Members of Parliament
| Election | Member[2] | Party | Notes | |
|---|---|---|---|---|
| 1918 | James Walton | Coalition National Democratic | ||
| 1922 | Thomas Williams | Labour | Shadow Minister of Agriculture (1951–1959) Minister of Agriculture, Fisheries and Food (1945–1951) | |
| 1959 | Richard Kelley | Labour | ||
| 1979 | Michael Welsh | Labour | ||
| 1983 | Martin Redmond | Labour | Died January 1997; no by-election held due to imminent general election | |
| 1997 | Caroline Flint | Labour | Shadow Secretary of State for Energy and Climate Change (7 October 2011 – 14 September 2015) Shadow Secretary of State for Communities and Local Government (8 October 2010 – 7 October 2011) Minister of State for Europe (3 October 2008 – 5 June 2009) Minister of State for Housing and Planning (24 January 2008 – 3 October 2008) Minister of State for Employment (28 June 2007 – 24 January 2008) Minister for Yorkshire and the Humber (28 June 2007 – 24 January 2008) Minister of State for Public Health (5 May 2005 – 28 June 2007) | |
| 2019 | Nick Fletcher | Conservative | ||
Elections
Elections in the 2010s
| Party | Candidate | Votes | % | ±% | |
|---|---|---|---|---|---|
| Conservative | Nick Fletcher | 19,609 | 43.2 | ||
| Labour | Caroline Flint | 15,979 | 35.2 | ||
| Brexit Party | Paul Whitehurst | 6,247 | 13.7 | New | |
| Liberal Democrats | Mark Alcock | 1,907 | 4.2 | ||
| Green | Kate Needham | 872 | 1.9 | New | |
| Yorkshire | Chris Holmes | 823 | 1.8 | ||
| Majority | 3,630 | 8.0 | N/A | ||
| Turnout | 44,614 | 60.3 | |||
| Conservative gain from Labour | Swing | ||||
| Party | Candidate | Votes | % | ±% | |
|---|---|---|---|---|---|
| Labour | Caroline Flint | 24,351 | 53.0 | ||
| Conservative | Aaron Bell | 19,182 | 41.7 | ||
| Yorkshire | Stevie Manion | 1,599 | 3.5 | New | |
| Liberal Democrats | Anthony Smith | 856 | 1.9 | ||
| Majority | 5,169 | 11.2 | |||
| Turnout | 45,988 | 62.2 | |||
| Labour hold | Swing | ||||
| Party | Candidate | Votes | % | ±% | |
|---|---|---|---|---|---|
| Labour | Caroline Flint | 19,621 | 46.2 | ||
| Conservative | Carl Jackson | 10,736 | 25.3 | ||
| UKIP | Guy Aston | 9,963 | 23.5 | ||
| Liberal Democrats | Rene Paterson | 1,487 | 3.5 | ||
| TUSC | Steve Williams | 437 | 1.0 | New | |
| English Democrat | Louise Dutton | 242 | 0.6 | ||
| Majority | 8,885 | 20.9 | |||
| Turnout | 42,486 | 59.6 | |||
| Labour hold | Swing | ||||
| Party | Candidate | Votes | % | ±% | |
|---|---|---|---|---|---|
| Labour | Caroline Flint | 16,472 | 37.9 | ||
| Conservative | Matt Stephens | 12,877 | 29.7 | ||
| Liberal Democrats | Edwin Simpson | 7,422 | 17.1 | ||
| BNP | Erwin Toseland | 2,112 | 4.9 | New | |
| UKIP | William Shaw | 1,904 | 4.4 | New | |
| English Democrat | Bernie Aston | 1,756 | 4.0 | New | |
| Independent | Martin Williams | 887 | 2.0 | New | |
| Majority | 3,595 | 8.2 | |||
| Turnout | 43,430 | 59.3 | |||
| Labour hold | Swing | ||||
Elections in the 2000s
| Party | Candidate | Votes | % | ±% | |
|---|---|---|---|---|---|
| Labour | Caroline Flint | 19,418 | 52.7 | ||
| Conservative | Adam Duguid | 10,820 | 29.4 | ||
| Liberal Democrats | Stewart Arnold | 6,626 | 18.0 | ||
| Majority | 8,598 | 23.3 | |||
| Turnout | 36,864 | 55.1 | |||
| Labour hold | Swing | ||||
| Party | Candidate | Votes | % | ±% | |
|---|---|---|---|---|---|
| Labour | Caroline Flint | 20,009 | 54.6 | ||
| Conservative | James Browne | 10,489 | 28.6 | ||
| Liberal Democrats | Philip Smith | 4,089 | 11.2 | ||
| Independent | Terry Wilde | 800 | 2.2 | New | |
| UKIP | David Cooper | 777 | 2.1 | New | |
| Socialist Labour | Nigel Ball | 466 | 1.3 | ||
| Majority | 9,520 | 26.0 | |||
| Turnout | 36,630 | 54.8 | |||
| Labour hold | Swing | ||||
Elections in the 1990s
| Party | Candidate | Votes | % | ±% | |
|---|---|---|---|---|---|
| Labour | Caroline Flint | 25,376 | 58.3 | ||
| Conservative | Clare H. Gledhill | 10,717 | 24.6 | ||
| Liberal Democrats | Paul Johnston | 4,238 | 9.7 | ||
| Referendum | Paul R. Davis | 1,379 | 3.2 | New | |
| Socialist Labour | Nigel Ball | 1,024 | 2.4 | New | |
| Green | Stephen Platt | 493 | 1.1 | ||
| ProLife Alliance | Claire D. Johnson | 330 | 0.8 | New | |
| Majority | 14,659 | 33.7 | |||
| Turnout | 43,557 | 66.4 | |||
| Labour hold | Swing | ||||
| Party | Candidate | Votes | % | ±% | |
|---|---|---|---|---|---|
| Labour | Martin Redmond | 32,008 | 55.0 | ||
| Conservative | Nicholas Paget-Brown | 18,474 | 31.7 | ||
| Liberal Democrats | M Jevons | 6,920 | 11.9 | ||
| Green | TS Platt | 803 | 1.4 | New | |
| Majority | 13,534 | 23.3 | |||
| Turnout | 58,205 | 76.3 | |||
| Labour hold | Swing | ||||
Elections in the 1980s
| Party | Candidate | Votes | % | ±% | |
|---|---|---|---|---|---|
| Labour | Martin Redmond | 29,200 | 53.1 | ||
| Conservative | Charles Gallagher | 17,733 | 32.3 | ||
| Liberal | Wilfrid Whitaker | 8,027 | 11.9 | ||
| Majority | 11,467 | 20.8 | |||
| Turnout | 54,960 | 73.8 | |||
| Labour hold | Swing | ||||
| Party | Candidate | Votes | % | ±% | |
|---|---|---|---|---|---|
| Labour | Martin Redmond | 23,036 | 45.1 | ||
| Conservative | B. Utting | 16,570 | 32.4 | ||
| Liberal | D. Lange | 11,482 | 22.5 | ||
| Majority | 6,466 | 12.7 | |||
| Turnout | 51,088 | 69.9 | |||
| Labour hold | Swing | ||||
Elections in the 1970s
| Party | Candidate | Votes | % | ±% | |
|---|---|---|---|---|---|
| Labour | Michael Welsh | 39,603 | 55.6 | ||
| Conservative | Roger Freeman | 22,243 | 31.2 | ||
| Liberal | E. Simpson | 8,238 | 11.6 | ||
| Workers Party | I. Connelly | 720 | 1.0 | New | |
| Workers Revolutionary | T. McCabe | 398 | 0.6 | New | |
| Majority | 17,360 | 24.4 | |||
| Turnout | 71,202 | 74.7 | |||
| Labour hold | Swing | ||||
| Party | Candidate | Votes | % | ±% | |
|---|---|---|---|---|---|
| Labour | Richard Kelley | 41,187 | 63.3 | ||
| Conservative | Peter J. Le Bosquet | 13,767 | 21.1 | ||
| Liberal | E. Simpson | 10,161 | 15.6 | ||
| Majority | 27,420 | 42.2 | |||
| Turnout | 65,115 | 73.6 | |||
| Labour hold | Swing | ||||
| Party | Candidate | Votes | % | ±% | |
|---|---|---|---|---|---|
| Labour | Richard Kelley | 48,737 | 70.1 | ||
| Conservative | P. J. Le Bosquet | 20,792 | 29.9 | ||
| Majority | 27,945 | 40.2 | |||
| Turnout | 69,529 | 79.1 | |||
| Labour hold | Swing | ||||
| Party | Candidate | Votes | % | ±% | |
|---|---|---|---|---|---|
| Labour | Richard Kelley | 42,496 | 69.5 | ||
| Conservative | Timothy Walter G Jackson | 18,673 | 30.5 | ||
| Majority | 23,823 | 39.0 | |||
| Turnout | 61,169 | 73.1 | |||
| Labour hold | Swing | ||||
Elections in the 1960s
| Party | Candidate | Votes | % | ±% | |
|---|---|---|---|---|---|
| Labour | Richard Kelley | 43,973 | 74.9 | ||
| Conservative | Richard Storey | 14,738 | 25.1 | ||
| Majority | 29,235 | 49.8 | |||
| Turnout | 58,711 | 78.3 | |||
| Labour hold | Swing | ||||
| Party | Candidate | Votes | % | ±% | |
|---|---|---|---|---|---|
| Labour | Richard Kelley | 42,452 | 71.9 | ||
| Conservative | David Philip Jeffcock | 16,593 | 28.1 | ||
| Majority | 25,859 | 43.8 | |||
| Turnout | 59,045 | 80.8 | |||
| Labour hold | Swing | ||||
Elections in the 1950s
| Party | Candidate | Votes | % | ±% | |
|---|---|---|---|---|---|
| Labour | Richard Kelley | 40,935 | 70.9 | ||
| Conservative | Geoffrey Dodsworth | 16,787 | 29.1 | ||
| Majority | 24,148 | 41.8 | |||
| Turnout | 57,722 | 83.8 | |||
| Labour hold | Swing | ||||
| Party | Candidate | Votes | % | ±% | |
|---|---|---|---|---|---|
| Labour | Thomas Williams | 38,433 | 73.7 | ||
| Conservative | Jack Victor Thornton | 13,701 | 26.3 | ||
| Majority | 24,732 | 47.4 | |||
| Turnout | 52,134 | 81.2 | |||
| Labour hold | Swing | ||||
| Party | Candidate | Votes | % | ±% | |
|---|---|---|---|---|---|
| Labour | Thomas Williams | 39,687 | 74.1 | ||
| Conservative | David S B Hopkins | 13,862 | 25.9 | ||
| Majority | 25,825 | 48.2 | |||
| Turnout | 53,549 | 85.9 | |||
| Labour hold | Swing | ||||
| Party | Candidate | Votes | % | ±% | |
|---|---|---|---|---|---|
| Labour | Thomas Williams | 39,789 | 74.0 | ||
| Conservative | Douglas Graham | 12,982 | 24.1 | ||
| Communist | Samuel Taylor | 1,007 | 1.9 | New | |
| Majority | 26,807 | 49.9 | |||
| Turnout | 53,778 | 87.7 | |||
| Labour hold | Swing | ||||
Elections in the 1940s
| Party | Candidate | Votes | % | ±% | |
|---|---|---|---|---|---|
| Labour | Thomas Williams | 40,153 | 71.7 | ||
| Conservative | J. J. A. N. Ross | 15,832 | 28.3 | ||
| Majority | 24,321 | 43.4 | |||
| Turnout | 55,985 | 73.2 | |||
| Labour hold | Swing | ||||
Elections in the 1930s
| Party | Candidate | Votes | % | ±% | |
|---|---|---|---|---|---|
| Labour | Thomas Williams | 33,220 | 68.9 | ||
| Conservative | John Arbuthnot | 14,961 | 31.1 | ||
| Majority | 18,259 | 37.8 | |||
| Turnout | 48,181 | 70.0 | |||
| Labour hold | Swing | ||||
| Party | Candidate | Votes | % | ±% | |
|---|---|---|---|---|---|
| Labour | Thomas Williams | 27,599 | 58.6 | ||
| Conservative | Samuel Hardwick | 19,506 | 41.4 | ||
| Majority | 8,093 | 17.2 | |||
| Turnout | 47,105 | 71.2 | |||
| Labour hold | Swing | ||||
Elections in the 1920s
| Party | Candidate | Votes | % | ±% | |
|---|---|---|---|---|---|
| Labour | Thomas Williams | 31,466 | 73.3 | ||
| Unionist | Walter Liddall | 11,467 | 26.7 | ||
| Majority | 19,999 | 46.6 | |||
| Turnout | 42,933 | 69.7 | |||
| Registered electors | 61,604 | ||||
| Labour hold | Swing | ||||
| Party | Candidate | Votes | % | ±% | |
|---|---|---|---|---|---|
| Labour | Thomas Williams | 14,958 | 53.9 | ||
| Unionist | John Wells Reynolds | 12,463 | 46.1 | ||
| Majority | 2,135 | 7.8 | |||
| Turnout | 27,421 | 72.8 | |||
| Registered electors | 37,184 | ||||
| Labour hold | Swing | ||||
| Party | Candidate | Votes | % | ±% | |
|---|---|---|---|---|---|
| Labour | Thomas Williams | 12,898 | 60.4 | ||
| Unionist | John Wells Reynolds | 8,451 | 39.6 | New | |
| Majority | 4,447 | 20.8 | |||
| Turnout | 21,349 | 62.2 | |||
| Registered electors | 34,339 | ||||
| Labour hold | Swing | N/A | |||
| Party | Candidate | Votes | % | ±% | |
|---|---|---|---|---|---|
| Labour | Thomas Williams | 9,903 | 47.0 | ||
| National Democratic | James Walton | 5,797 | 27.6 | ||
| Liberal | John Henry Freeborough | 5,332 | 25.4 | ||
| Majority | 4,106 | 19.4 | N/A | ||
| Turnout | 21,032 | 65.4 | |||
| Registered electors | 32,175 | ||||
| Labour gain from National Democratic | Swing | ||||
Elections in the 1910s
| Party | Candidate | Votes | % | ±% | |
|---|---|---|---|---|---|
| C | National Democratic | James Walton | 6,095 | 46.2 | |
| Liberal | Hastings Lees-Smith | 3,868 | 29.3 | ||
| Labour | Edward Hough | 3,226 | 24.5 | ||
| Majority | 2,227 | 16.9 | |||
| Turnout | 13,189 | 45.9 | |||
| Registered electors | 28,724 | ||||
| National Democratic win (new seat) | |||||
| C indicates candidate endorsed by the coalition government. | |||||
Notes and references
- Notes
- A county constituency (for the purposes of election expenses and type of returning officer)
- As with all constituencies, the constituency elects one Member of Parliament (MP) by the first past the post system of election at least every five years.
- References
- "Constituency data: electorates – House of Commons Library". Parliament UK. 15 June 2020. Retrieved 22 July 2020.
- Leigh Rayment's Historical List of MPs – Constituencies beginning with "D" (part 2)
- https://dmbcwebstolive01.blob.core.windows.net/media/Default/Council%20and%20Democracy/Elections/SOPN%20Don%20Valley_A3.pdf
- "General Parliamentary Elections 2017". Doncaster Council. Retrieved 11 December 2019.
- "Election Data 2015". Electoral Calculus. Archived from the original on 17 October 2015. Retrieved 17 October 2015.
- "Don Valley". BBC News. Retrieved 14 May 2015.
- "Election Data 2010". Electoral Calculus. Archived from the original on 26 July 2013. Retrieved 17 October 2015.
- "Don Valley". BBC News, election 2010. BBC. 6 May 2010. Retrieved 8 May 2010.
- "Election Data 2005". Electoral Calculus. Archived from the original on 15 October 2011. Retrieved 18 October 2015.
- "Election Data 2001". Electoral Calculus. Archived from the original on 15 October 2011. Retrieved 18 October 2015.
- "Election Data 1997". Electoral Calculus. Archived from the original on 15 October 2011. Retrieved 18 October 2015.
- "Election Data 1992". Electoral Calculus. Archived from the original on 15 October 2011. Retrieved 18 October 2015.
- "Politics Resources". Election 1992. Politics Resources. 9 April 1992. Archived from the original on 24 July 2011. Retrieved 6 December 2010.
- "Election Data 1987". Electoral Calculus. Archived from the original on 15 October 2011. Retrieved 18 October 2015.
- "Election Data 1983". Electoral Calculus. Archived from the original on 15 October 2011. Retrieved 18 October 2015.
Sources
- Guardian Unlimited Politics (Election results from 1992 to the present)
- Politicsresources.net - Official Web Site ✔ (Election results from 1951 to the present)
- F. W. S. Craig, British Parliamentary Election Results 1918 - 1949
- F. W. S. Craig, British Parliamentary Election Results 1950 - 1970