Elections in Trinidad and Tobago
Elections in Trinidad and Tobago gives information on election and election results in Trinidad and Tobago.
 |
|---|
| This article is part of a series on the politics and government of Trinidad and Tobago |
|
|
Trinidad and Tobago elects on national level a House of Representatives (the Lower House of its legislature). The head of government the Prime Minister, is chosen from among the elected representatives on the basis of his/ her command of the support of the majority of legislators. The Parliament of the Republic of Trinidad and Tobago has two chambers. The House of Representatives has 41 members, elected for a maximum five-year term in single-seat constituencies. The Senate has 31 members: 16 Government Senators appointed on the advice of the Prime Minister, 6 Opposition Senators appointed on the advice of the Leader of the Opposition and 9 so-called Independent Senators appointed by the President to represent other sectors of civil society. The president is elected for a five-year term by an electoral college consisting of the members of both houses of Parliament. Other elected bodies include the Local Government bodies in Trinidad (2 cities, 3 boroughs, 9 Regional Corporations)[1] and the Tobago House of Assembly which handles local government in the island of Tobago and is entrenched in the Constitution.
Until 1925 Trinidad and Tobago was a British Colony ruled through a pure, unelected Crown Colony system, although elected Borough and Municipal Councils existed in Port of Spain and San Fernando. The first elections to the Legislative Council took place in 1925. Seven of the thirteen unofficial members were elected, six unofficials were nominated by the Governor, and twelve official members sat in the Legislative Council on an ex-officio basis. The Governor had the right to an ordinary vote and an additional casting vote, to break any tie. The franchise was determined by income, property and residence qualifications, and was limited to men over the age of 21 and women over the age of 30. The 1946 elections were the first with universal adult suffrage, during which time there existed an even number of elected and unelected members (excluding the Governor).
Latest and upcoming elections
General elections
.svg.png.webp)
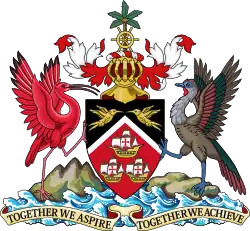
2020 general elections
 | ||||||
| Parties | Votes | % | +/- | Seats | +/- | |
|---|---|---|---|---|---|---|
| People's National Movement | 322,250 | 49.08 | 22 | |||
| United National Congress | 309,188 | 47.09 | 19 | |||
| Progressive Democratic Patriots | 10,367 | 1.58 | New | 0 | New | |
| Progressive Empowerment Party | 5,933 | 0.90 | New | 0 | New | |
| Independent Liberal Party | 3,817 | 0.58 | 0 | |||
| Movement for Social Justice | 1,223 | 0.19 | N/a | 0 | ||
| Movement for National Development | 1,039 | 0.16 | New | 0 | New | |
| COP–DPTT–TTDF | 524 | 0.08 | 0 | |||
| New National Vision | 493 | 0.08 | 0 | |||
| Trinidad Humanity Campaign | 366 | 0.06 | 0 | |||
| National Organisation of We the People | 310 | 0.05 | New | 0 | New | |
| National Coalition for Transformation | 234 | 0.04 | N/a | 0 | ||
| Progressive Party | 211 | 0.03 | New | 0 | New | |
| One Tobago Voice | 80 | 0.01 | New | 0 | New | |
| Unrepresented Peoples Party | 73 | 0.01 | New | 0 | New | |
| Unity of the People | 40 | 0.01 | New | 0 | New | |
| The National Party | 23 | 0.00 | New | 0 | New | |
| Independents | 351 | 0.05 | 0 | |||
| Valid votes | 656,522 | 99.73 | ||||
| Blank and invalid votes | 1,775 | 0.27 | ||||
| Total | 658,297 | 100 | – | 41 | = | |
| Abstentions | 475,838 | 41.96 | ||||
| Registered voters/turnout | 1,134,135 | 58.04 | ||||
2015 general elections

 | |||||||||
| Party | Votes | % | Seats | +/– | |||||
|---|---|---|---|---|---|---|---|---|---|
| People's National Movement | 378,447 | 51.68 | 23 | +11 | |||||
| United National Congress (PP) | 290,066 | 39.61 | 17 | −4 | |||||
| Congress of the People (PP) | 43,991 | 6.01 | 1 | −5 | |||||
| National Joint Action Committee (PP) | 5,790 | 0.79 | 0 | 0 | |||||
| Independent Liberal Party | 5,123 | 0.70 | 0 | New | |||||
| Tobago Forwards | 2,162 | 0.30 | 0 | New | |||||
| Tobago Organisation of the People (PP) | 1,750 | 0.24 | 0 | −2 | |||||
| New National Vision | 883 | 0.12 | 0 | 0 | |||||
| Platform of Truth | 469 | 0.06 | 0 | New | |||||
| Laventille Outreach for Vertical Enrichment | 334 | 0.05 | 0 | New | |||||
| National Coalition for Transportation | 331 | 0.05 | 0 | New | |||||
| Democratic Development Party | 153 | 0.02 | 0 | New | |||||
| Trinidad Humanity Campaign | 138 | 0.02 | 0 | New | |||||
| Independent Democratic Party | 108 | 0.01 | 0 | New | |||||
| The New Voice | 101 | 0.01 | 0 | New | |||||
| Youth, National Organisations, Farmers Unification, Policy Reformation | 74 | 0.01 | 0 | New | |||||
| Youth Empowerment Party | 34 | 0.00 | 0 | New | |||||
| Independents | 2,376 | 0.32 | 0 | 0 | |||||
| Invalid/blank votes | 2,452 | – | – | – | |||||
| Total | 734,792 | 100 | 41 | 0 | |||||
| Registered voters/turnout | 1,099,279 | 66.84 | – | – | |||||
| Source: EBC | |||||||||
2010 general elections
 | |||||||||
| Parties | Votes | % | Seats | ||||||
|---|---|---|---|---|---|---|---|---|---|
| People's Partnership Coalition | 432,026 | 60.03 | 29 | ||||||
| People's National Movement | 285,354 | 39.65 | 12 | ||||||
| New National Vision | 1,998 | 0.28 | 0 | ||||||
| Independents | 349 | 0.05 | 0 | ||||||
| Total valid (turnout 69.45%) | 719,727 | 100.00 | 41 | ||||||
| Invalid | 2,595 | ||||||||
| Total | 722,322 | ||||||||
| Source: EBC, Caribbean elections | |||||||||
2007 general elections
 | |||||||||
| Parties | Votes | % | Seats | ||||||
|---|---|---|---|---|---|---|---|---|---|
| People's National Movement | 299,813 | 45.85 | 26 | ||||||
| United National Congress–Alliance | 194,425 | 29.73 | 15 | ||||||
| Congress of the People | 148,041 | 22.64 | 0 | ||||||
| Democratic Action Congress | 8,801 | 1.35 | 0 | ||||||
| Democratic National Assembly | 376 | 0.01 | 0 | ||||||
| Independents | 120 | 0.00 | 0 | ||||||
| Total valid (turnout 66%) | 651,576 | 100.00 | 41 | ||||||
| Invalid | 2,306 | ||||||||
| Total | 653,882 | ||||||||
| Source: EBC | |||||||||
2002 general elections
| Parties | Votes | % | Seats |
|---|---|---|---|
| People's National Movement | 298,629 | 50.9 | 20 |
| United National Congress | 284,391 | 46.9 | 16 |
| Others | 13,614 | 2.2 | 0 |
| Rejected | 2,804 | - | - |
1956 federal elections
| Party | Seats Won | Votes |
|---|---|---|
| People's National Movement | 4 | 47.4% |
| Democratic Labour Party | 6 | 47.4% |
| Butler Party | 0 | 4.9% |
| Independents | 0 | 0.2% |
| Rejected | 1.8% |
1950 general elections
| Party | Seats Won | Votes |
|---|---|---|
| Butler Home Rule Party | 8 | 23.4% |
| Political Progress Groups | 2 | 3.3% |
| Caribbean Socialist Party | 2 | 12.4% |
| Trinidad Labour Party | 2 | 7.7% |
| Trades Union Council | 0 | 4.5% |
| Independents | 6 | 46.7% |
| Rejected | 4.3% |
(A.P.T. James contested and won the Tobago seat on both a Butler Party and CSP ticket; James' votes are only counted in the Butler Party total).
Local elections
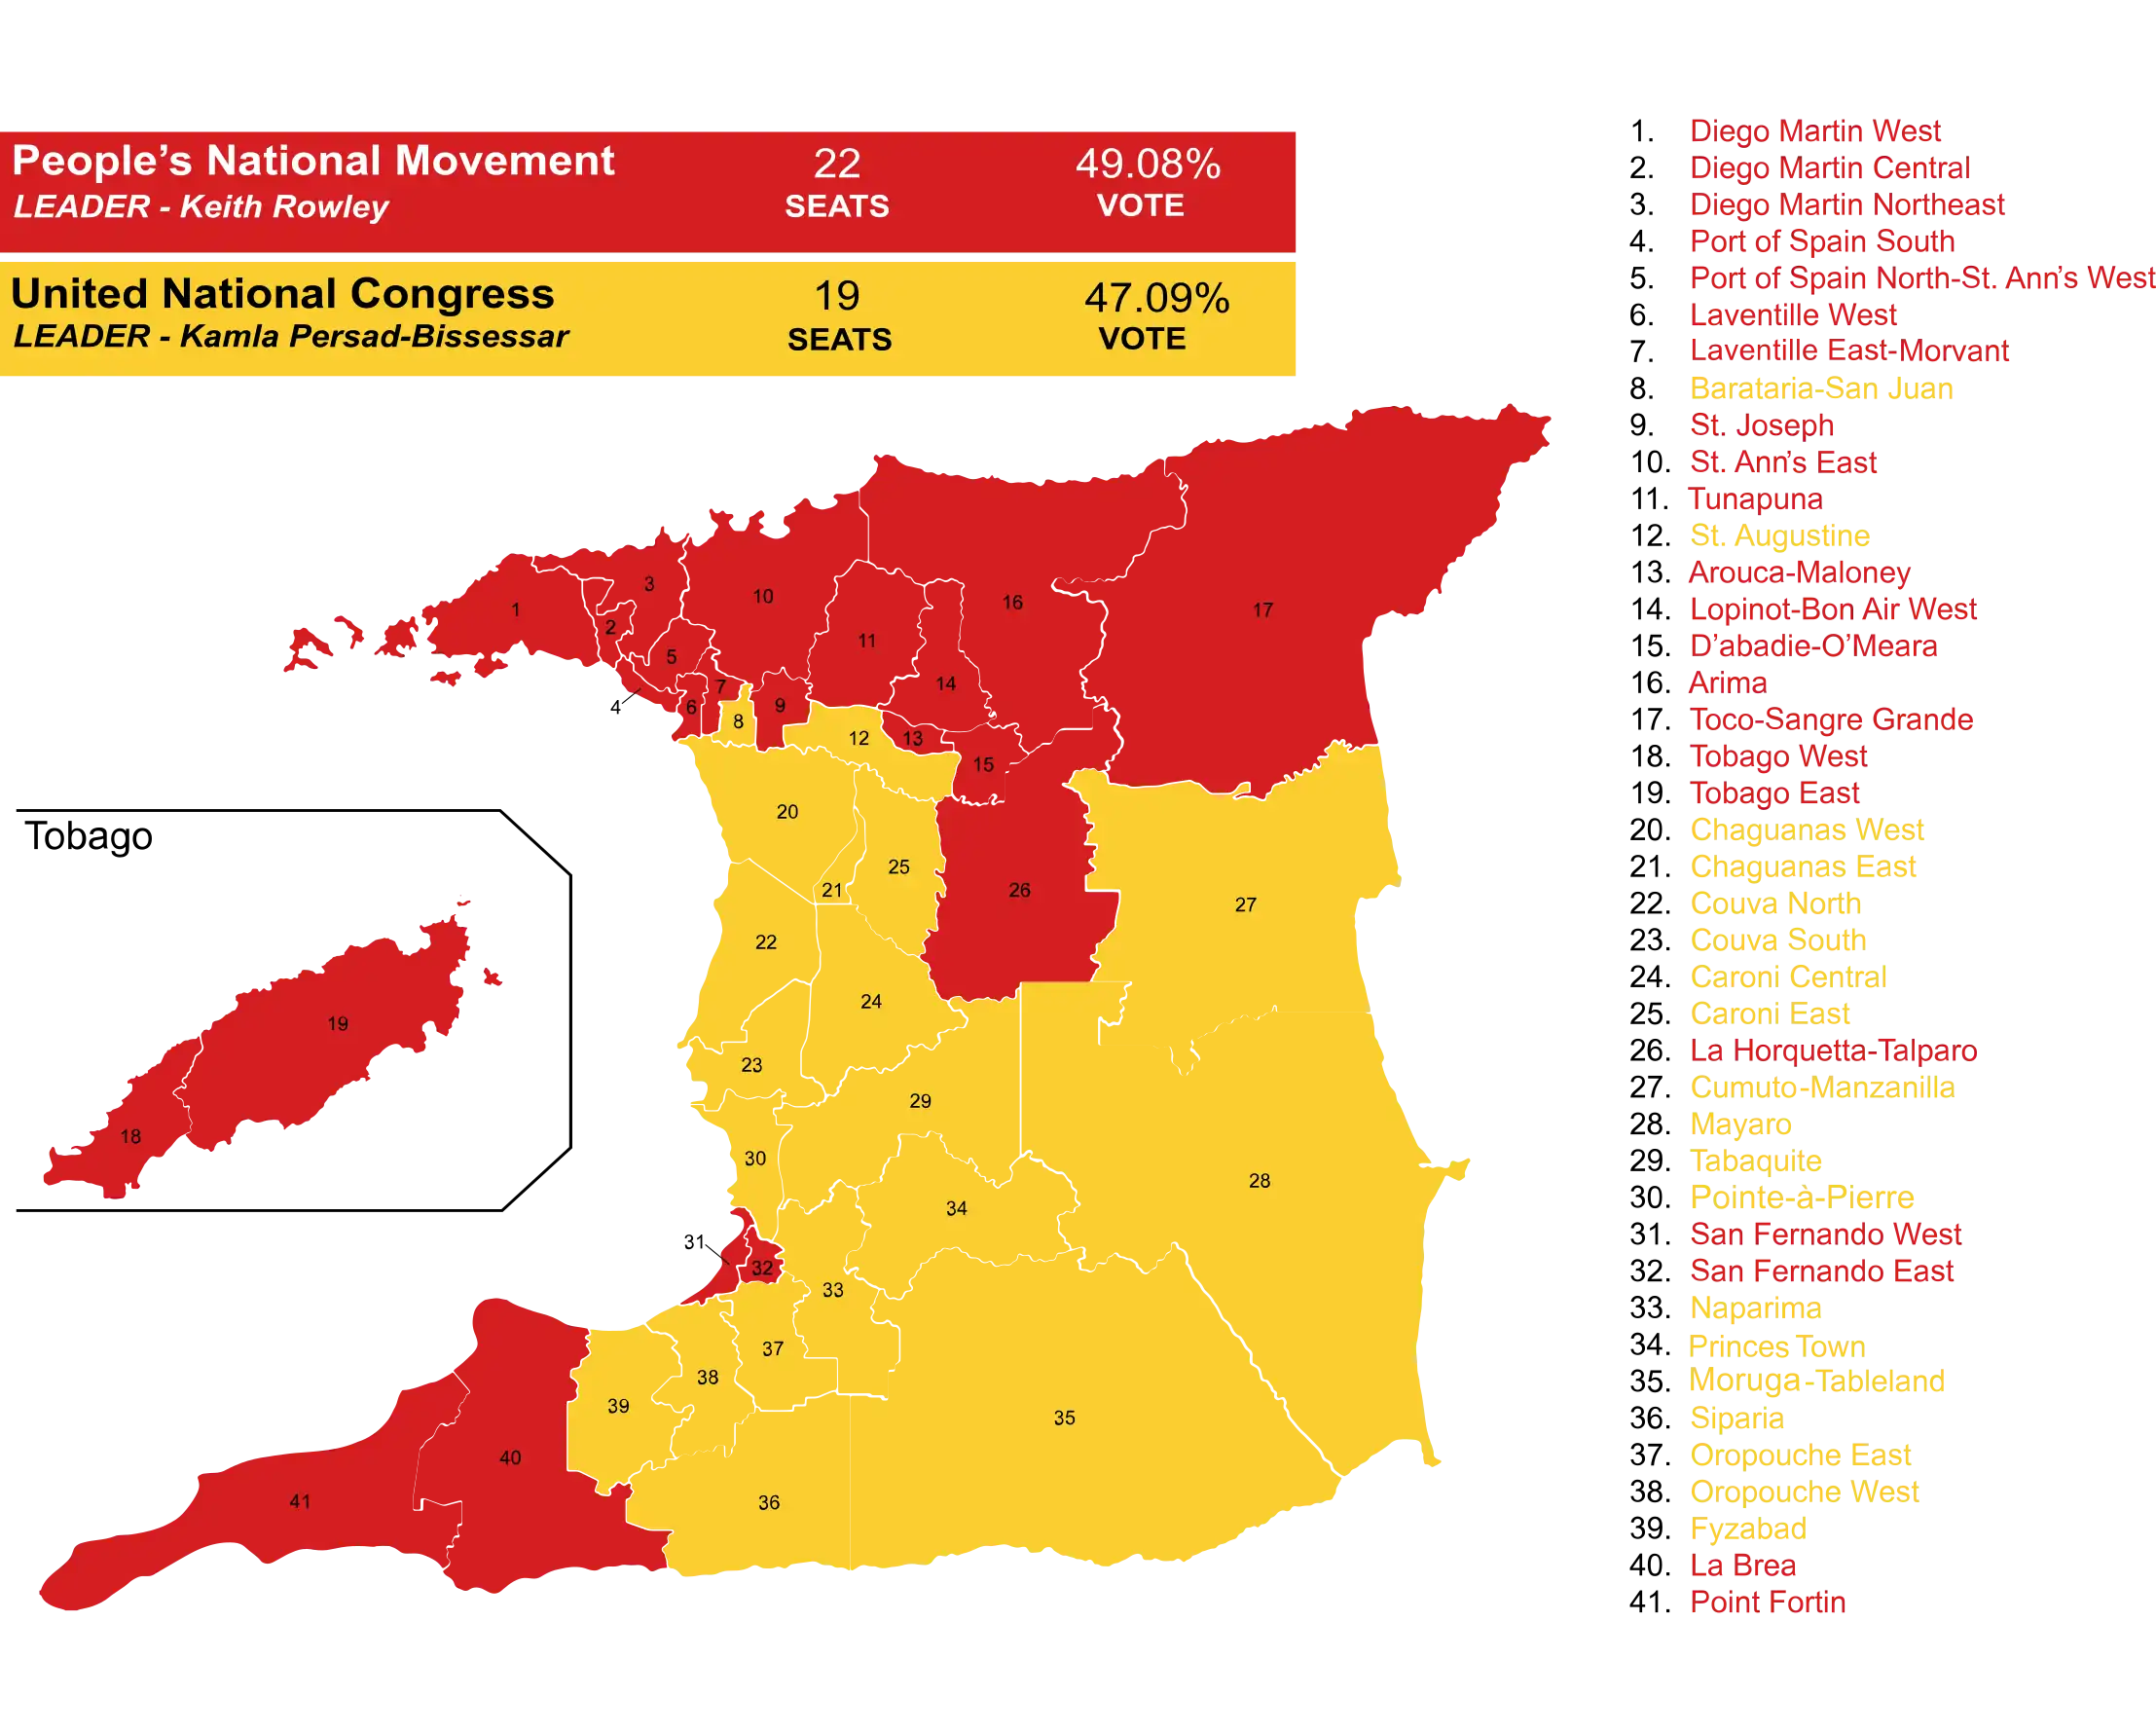
Trinidad
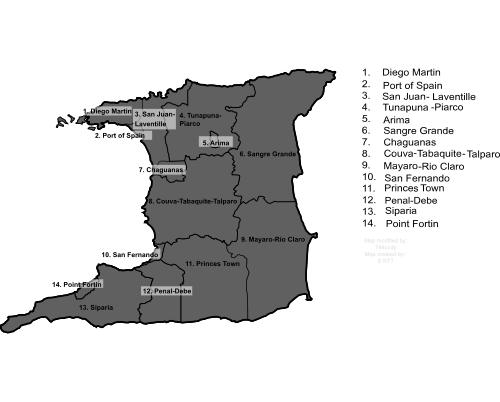
2019 local government elections
| Party | Councillors | % of councillors | Votes | % of Votes | |||||||||
|---|---|---|---|---|---|---|---|---|---|---|---|---|---|
| 2016 | 2019 | +/- | 2016 | 2019 | +/- | 2016 | 2019 | +/- | 2016 | 2019 | +/- | ||
| PNM | 83 | 72 | 60.6% | 51.8% | 174,754 | 162,801 | 48.24% | 43.60% | |||||
| UNC | 54 | 67 | 39.4% | 48.2% | 180,758 | 203,868 | 49.90% | 54.59% | |||||
| MSJ | 0 | 0 | 0.0% | 0.0% | 790 | 2,608 | 0.22% | 0.70% | |||||
| PPM | n/a | 0 | n/a | n/a | 0.0% | n/a | n/a | 1,349 | n/a | n/a | 0.36% | n/a | |
| COP | 0 | 0 | 0.0% | 0.0% | 1,803 | 899 | 0.50% | 0.24% | |||||
| MND | n/a | 0 | n/a | n/a | 0.0% | n/a | n/a | 403 | n/a | n/a | 0.11% | n/a | |
| NTP | n/a | 0 | n/a | n/a | 0.0% | n/a | n/a | 11 | n/a | n/a | 0.00% | n/a | |
| Independent | 0 | 0 | 0.0% | 0.0% | 1,071 | 521 | 550 | 0.30% | 0.86% | ||||
| Total | 137[5] | 139 | 100% | 100% | 362,254 | 373,437 | 100% | 100% | |||||
| Electorate: 1,079,976 Total votes: 373,437 Turnout: 34.71% | |||||||||||||
2016 local government elections
| Party | Candidates | Votes | % | Seats | +/– | Councils | +/– |
|---|---|---|---|---|---|---|---|
| People's National Movement | 136 | 174,754 | 48.24 | 83 / 137 |
7 / 14 |
||
| United National Congress | 134 | 180,758 | 49.90 | 54 / 137 |
6 / 14 |
||
| Congress of the People | 9 | 1,803 | 0.49 | 0 | 0 | - | |
| Movement for Social Justice | 11 | 790 | 0.22 | 0 | - | 0 | - |
| Independent Liberal Party | 7 | 343 | 0.09 | 0 | 0 | - | |
| National Solidarity Assembly | 9 | 804 | 0.22 | 0 | - | - | - |
| National Democratic Party | 3 | 244 | 0.07 | 0 | - | - | - |
| Independent Democratic Party | 1 | 602 | 0.17 | 0 | - | - | - |
| Independents | 4 | 1,071 | 0.30 | 0 | - | - | - |
| No Overall Control | - | - | - | - | - | 1 | - |
| Invalid/blank votes | - | 1,085 | – | – | – | - | - |
| Total | 314 | 362,254 | 100 | 137 | 14 | - | |
| Registered voters/turnout | 1,054,817 | 34.3 ( |
– | – | – | – | |
| Source: EBC | |||||||
2013 local government elections
2010 local government elections
2003 local government elections
| Summary of the 2003 Local Government election results | Votes | % | Seats |
|---|---|---|---|
| People's National Movement | ?? | ?? | 83 |
| United National Congress | ?? | 43 | |
| National Alliance for Reconstruction | ?? | 00 | |
| Independents | ?? | 00 | |
| Total | 378,637 | 100 | 126 |
1999 local government elections
| Party | Seats Won | Votes |
|---|---|---|
| National Alliance for Reconstruction | 0 | 0.2% |
| People's National Movement | 67 | 46.3% |
| United National Congress | 57 | 51.5% |
| PPM | 0 | 0.0% |
| Independents | 0 | 1.0% |
| Rejected | 0.9% |
1996 local government elections
| Party | Seats Won | Votes |
|---|---|---|
| National Alliance for Reconstruction | 0 | 5.6% |
| People's National Movement | 63 | 43.7% |
| United National Congress | 61 | 49.9% |
| Independents | 0 | 0.6% |
| Rejected | 0.8% |
1992 local government elections
| Party | Seats Won | Votes |
|---|---|---|
| National Alliance for Reconstruction | 0 | 11.0% |
| People's National Movement | 86 | 50.3% |
| United National Congress | 53 | 36.9% |
| Independents | 0 | 0.8% |
| Rejected | 1.0% |
1987 local government elections
| Party | Seats Won | Votes |
|---|---|---|
| National Alliance for Reconstruction | 79 | 58.5% |
| People's National Movement | 46 | 39.3% |
| People's Popular Movement | 0 | 0.1% |
| Progressive Workers Democrat Movement | 0 | 0.0% |
| Independents | 0 | 1.6% |
| Rejected | 0.6% |
1983 local government elections
| Party | Seats Won | Votes |
|---|---|---|
| National Alliance | 40 | 34.0% |
| Organisation for National Reconstruction | 26 | 20.1% |
| People's National Movement | 54 | 39.1% |
| National Joint Action Committee | 0 | 5.3% |
| Curepe United People's Committee | 0 | 0.1% |
| Independents | 0 | 0.5% |
| Rejected | 0.9% |
1980 local government elections
| Party | Seats Won | Votes |
|---|---|---|
| People's National Movement | 100 | 57.8% |
| United Labour Front | 9 | 31.9% |
| Point Fortin Vigilante Welfare Group | 0 | 1.3% |
| Tapia House Movement | 0 | 0.4% |
| Independents | 4 | 7.6% |
| Rejected | 1.0% |
1977 local government elections
| Party | Seats Won | Votes |
|---|---|---|
| Democratic Action Committee | 4 | 6.6% |
| People's National Movement | 69 | 51.1% |
| United Labour Front | 27 | 37.8% |
| Democratic Labour Party | 0 | 1.2% |
| Tapia House Movement | 0 | 0.3% |
| Independents | 0 | 2.4% |
| Rejected | 0.7% |
1971 local government elections
| Party | Seats Won | Votes |
|---|---|---|
| People's National Movement | 90 | 52.1% |
| National Progressive Party | 1 | 4.0% |
| Independents | 9 | 43.8% |
| Rejected | 0.0% |
Election boycott
1968 local government elections
| Party | Seats Won | Votes |
|---|---|---|
| People's National Movement | 68 | 49.4% |
| Democratic Labour Party | 28 | 40.0% |
| United Country Group, St Andrew-St. David | 0 | 0.8% |
| Independents | 4 | 9.3% |
| Rejected | 0.0% |
1959 county council elections
| Party | Seats Won | Votes |
|---|---|---|
| People's National Movement | 34 | 48.1% |
| Democratic Labour Party | 33 | 41.6% |
| Butler Party | 2 | 2.9% |
| Independents | 3 | 2.7% |
| Rejected | 0.8% |
Tobago


References
- Julien, Joel (26 July 2010). "T&T goes to the polls again". Trinidad and Tobago Express. Archived from the original on 30 July 2010. Retrieved 26 Jul 2010.
There are 14 municipalities comprising two cities, three boroughs and nine regional corporations up for grabs today. There are 134 electoral districts in all and a councillor has to be elected for each district.
- "The Preliminary Results of the 2020 Parliamentary Elections" (PDF). Archived (PDF) from the original on 5 September 2020. Retrieved 21 August 2020.
- "2020 Trinidad Express Election Map". Archived from the original on 9 August 2020. Retrieved 10 August 2020.
- "EBC releases preliminary election results". CNC3. 12 August 2020. Archived from the original on 20 August 2020. Retrieved 21 August 2020.
- "BATTLE FOR 139 SEATS". Trinidad and Tobago Newsday. 2 December 2019. Retrieved 11 December 2019.
- Election and Boundaries Commission. "Comparison of Local Election Results 1968 - 2013" (PDF). Retrieved 25 May 2018.
External links
| General elections |
| ||
|---|---|---|---|
| Local elections |
| ||