Fibonacci retracement
In finance, Fibonacci retracement is a method of technical analysis for determining support and resistance levels.[1] They are named after their use of the Fibonacci sequence.[1] Fibonacci retracement is based on the idea that markets will retrace a predictable portion of a move, after which they will continue to move in the original direction.
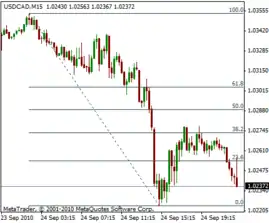
The appearance of retracement can be ascribed to ordinary price volatility as described by Burton Malkiel, a Princeton economist in his book A Random Walk Down Wall Street, who found no reliable predictions in technical analysis methods taken as a whole. Malkiel argues that asset prices typically exhibit signs of random walk and that one cannot consistently outperform market averages. Fibonacci retracement is created by taking two extreme points on a chart and dividing the vertical distance by the key Fibonacci ratios. 0.0% is considered to be the start of the retracement, while 100.0% is a complete reversal to the original part of the move. Once these levels are identified, horizontal lines are drawn and used to identify possible support and resistance levels (see trend line). The significance of such levels, however, could not be confirmed by examining the data.[2] Arthur Merrill in Filtered Waves determined there is no reliably standard retracement: not 50%, 23.6%, 38.2%, 61.8%, nor any other.
Common Uses
Fibonacci retracement is a popular tool that technical traders use to help identify strategic places for transactions, stop losses or target prices to help traders get in at a good price. The retracement concept is used in many indicators such as Tirone levels, Gartley patterns, Elliott Wave theory and more. After a significant movement in price (be it up or down) the new support and resistance levels are often at these lines.
Unlike moving averages, Fibonacci retracement levels are static prices. They do not change. This allows quick and simple identification and allows traders and investors to react when price levels are tested. Because these levels are inflection points, traders expect some type of price action, either a break or a rejection. The 0.617 Fibonacci retracement that is often used by stock analysts approximates to the "golden ratio".[1]
See also
References
- Aspray, Tom (13 August 2011). "Fibonacci analysis – Master the basics". Forbes. Retrieved 24 October 2016.
- Kempen, René (2016). "Fibonaccis are human (made)" (PDF). IFTA Journal.
- Stevens, Leigh (2002). Essential technical analysis: tools and techniques to spot market trends. New York: Wiley. ISBN 0-471-15279-X. OCLC 48532501.
- Brown, Constance M. (2008). Fibonacci analysis. New York: Bloomberg Press. ISBN 978-1-57660-261-4.
- Posamentier, Alfred S.; Lehmann, Ingmar (2007). The fabulous Fibonacci numbers. Amherst, NY: Prometheus Books. ISBN 978-1-59102-475-0.
- Malkiel, Burton (2011). A random walk down Wall Street: the time-tested strategy for successful investing. OCLC 50919959.
- MFTA Pershikov, Viktor (2014). The Complete Guide To Comprehensive Fibonacci Analysis on FOREX. ISBN 978-1607967606.
- Bhattacharya, Sukanto and Kumar, Kuldeep (2006) A computational exploration of the efficacy of Fibonacci sequences in technical analysis and trading. Annals of Economics and Finance, Volume 7, Issue 1, May 2006, pp. 219–230. http://epublications.bond.edu.au/business_pubs/32/
- Chatterjee, Amitava, O. Felix Ayadi, and Balasundram Maniam. "The Applications Of The Fibonacci Sequence And Elliott Wave Theory In Predicting The Security Price Movements: A Survey." Journal of Commercial Banking and Finance 1 (2002): 65–76.
- Tai-Liang Chena, Ching-Hsue Chenga, Hia Jong Teoha. Fuzzy time-series based on Fibonacci sequence for stock price forecasting. Physica A: Statistical Mechanics and its Applications, Volume 380, 1 July 2007, Pages 377–390.
External links
- Guide to Fibonacci Retracement Levels based on the Fibonacci Sequence at hotcandlestick.com
- What is Fibonacci retracement, and where do the ratios that are used come from? at investopedia.com
- Fibonacci Retracements at stockcharts.com
- Number Sequence Fibonacci Retracement at tradersdaytrading.com
- Using the Fibonacci Line in Technical Analysis at xBinOp.com
- Fibonacci Practical Example at iqoption-com.eu
