Genstat
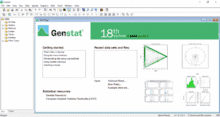
Genstat (General Statistics) is a statistical software package with data analysis capabilities, particularly in the field of agriculture.[2][3]
 | |
| Original author(s) | John Nelder |
|---|---|
| Developer(s) | VSN International (VSNi) |
| Stable release | 19.1
/ December 2017[1] |
| Operating system | Windows |
| Available in | English |
| Type | Statistical package |
| Licence | proprietary |
| Website | www |
Since 1968, it has been developed by many scientific experts in Rothamsted Research, and has a user-friendly interface,[4] professional modular design, excellent linear mixed models[5] and graphic functions. Leading Genstat’s continued development and distribution is VSN International (VSNi),[6] which is owned by The Numerical Algorithms Group and Rothamsted Research.
Genstat is used in a number of research areas, including plant science, forestry, animal science, and medicine,[7] and is recognized by several world-class universities and enterprises.
Applications
Genstat’s statistical software can be applied to the following user areas:
- Agriculture (Animal and Plant)
- Biology, Genetics
- Ecology, Environment (Forestry and Soil)
- Food Science
- Medical and Pharmaceutical
- Finance
- Industry, Engineering
- Statistics and Mathematics
Software product

Statistical features
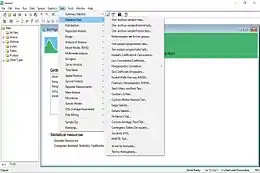
- Manage data on Genstat’s own spreadsheet (vector, scalar, table, matrix);
- Compatible with Excel spreadsheets (import/export);
- Illustrate data with graphics such as histograms, boxplots, scatter plots, line graphs, trellis plots, contour 3-dimensional surface plots, Kernel plots, species, Variogram, Regular grid, Irregular grid, circular plots and polar plots;
- Summarize and compare data with tabular reports, fitted distributions, and standard tests, such as t-tests, Chi-square tests, ANOVA, regression, and various nonparametric tests;
- Transform data using a general calculation facility with a wide range of mathematical and statistical functions;
- Model relationships between variables by linear or nonlinear regression, generalized linear models, generalized additive models, generalized linear mixed models or hierarchical generalized linear models, Logistics regression, Multinomial regression;
- Analyze experimental Design, ranging from One-Way ANOVA, Two-way ANOVA, Factorial Design, complex designs with several sources of error variation, using a balanced-ANOVA or a REML approach (including the modeling of correlation structures);
- Design investigations deciding on the sample size, or numbers of replicates, required to detect the anticipated treatment effects;
- Identify patterns in data by means of Multivariate techniques such as Canonical Variates Analysis, Discriminant Analysis, Factor Analysis, Cluster Analysis, Principal Components Analysis, principal coordinates analysis, MANOVA, correspondence analysis, partial least squares, classification trees and cluster analysis;
- Analyze results from Stratified Sampling or from Unstructured surveys, Simple Random Sampling, Cluster sampling;
- Analyze Six Sigma, plot Control charts, print Pareto tables and calculate capability statistics;
- Analyze Time Series, using Box-Jenkins Models or spectral analysis, Moving Average, ARIMA, Season Models;
- Analyze repeated measurements, by profile plot, analysis of variance, Multivariate, Generalized Estimating Equations, or using ante dependence structure, or by modeling the correlation over time;
- Analyze spatial patterns, using Variogram, Kriging, Automatic Analysis of Row-Column Design, Incomplete Block Design, or spatial point processes.
See also
- ASReml - is a statistical package which fits linear mixed models to large data sets with complex variance models using Residual Maximum Likelihood (REML).
- BMS – Breeding Management Systems
References
- What's New.
- "AGRONOMIX Software inc., Software for plant breeding".
- "The university of WARWICK".
- The multivariate Social Scientist.
- Mixed Models and Multilevel Data Structures in Agriculture.
- "VSNi".
- "The university of WARWICK".
Further reading
Payne, R. W. (2009). "Genstat". Wiley Interdisciplinary Reviews: Computational Statistics. 1 (2): 255–258. doi:10.1002/wics.32.
