Grafana
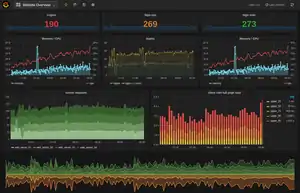
Grafana is a multi-platform open source analytics and interactive visualization web application. It provides charts, graphs, and alerts for the web when connected to supported data sources. Grafana Enterprise version with additional capabilities is also available.[4] It is expandable through a plug-in system. End users can create complex monitoring dashboards[5] using interactive query builders.
 | |
| Developer(s) | Grafana Labs |
|---|---|
| Initial release | 2014[1] |
| Stable release | 7.3.5
/ December 10, 2020[2] |
| Repository | https://github.com/grafana/grafana |
| Written in | Go |
| Operating system | Cross-platform |
| Type | Application software |
| License | Apache 2.0[3] |
| Website | grafana.com |
As a visualization tool, Grafana is a popular component in monitoring stacks,[6] often used in combination with time series databases such as InfluxDB, Prometheus[7][8] and Graphite;[9] monitoring platforms such as Sensu,[10] Icinga, Checkmk,[11] Zabbix, Netdata,[8] and PRTG; SIEMs such as Elasticsearch[7] and Splunk; and other data sources.
History
Grafana was first released in 2014 by Torkel Ödegaard as an offshoot of a project at Orbitz. It targeted time series databases such as InfluxDB, OpenTSDB, and Prometheus, but evolved to support relational databases such as MySQL, PostgreSQL and Microsoft SQL Server. In 2019, Grafana Labs secured $24 million in Series A funding.[12]
The Grafana user interface was originally based on version 3 of Kibana.[13]
The conference GrafanaCon 2020 was scheduled for May 13–14, 2020, in Amsterdam, but was changed to a two-day online live streaming event due to the COVID-19 pandemic.[14][15]
Licensing
In addition to the Apache license, contributors to Grafana need to sign a Contributor License Agreement that gives Grafana Labs the right to relicense Grafana in the future, as long as the new license is an open-source license according to OSI. The CLA is based on the Harmony Contributor Agreement.[17]
References
- https://github.com/grafana/grafana/releases/tag/v1.0
- "Grafana v7.3.5 release". 2020-11-24. Retrieved 17 December 2020.
- "LICENSE.md". 2017-11-24. Retrieved 2018-10-10.
- https://grafana.com/products/enterprise/
- Perrin, Jim. "Monitoring Linux performance with Grafana". OpenSource.com. Retrieved 14 October 2018.
- Anadiotis, George. "DevOps and observability in the 2020s". ZDNet. Retrieved 2020-02-04.
- Jones, Anna (2019-01-25). "Open Source Monitoring Stack: Prometheus and Grafana". Bizety. Retrieved 2019-05-08.
- DeLosSantos, Louis (2018). "Netdata, Prometheus, Grafana stack". Netdata Documentation. Retrieved 2019-05-08.
- Assaraf, Ariel. "Grafana Vs Graphite". Coralogix.
- Kumar, Santhosh; Muruganantham, Logeshkumar (2017-01-21). "Step By Step: Install and Configure Sensu + Grafana". Powerupcloud Tech Blog. Retrieved 2019-05-08.
- "Exporting Check_MK Performance Data to Grafana". TruePath Technologies. 2018. Retrieved 2020-09-24.
- Anadiotis, George. "Is open source the way to go for observability? Grafana Labs scores $24M Series A funding to try to prove this". ZDNet. Retrieved 2020-02-04.
- Ödegaard, Torkel (2019-09-03). "The (Mostly) Complete History of Grafana UX". grafana.com. Retrieved 2020-10-06.
- "GrafanaCon 2020 | Grafana Labs". grafana.com. Retrieved 4 May 2020.
Since you can’t come to GrafanaCon, GrafanaCONline is coming to you.
- Dam, Julie (12 December 2019). "Register Now! GrafanaCon 2020 Is Coming to Amsterdam May 13-14". grafana.com.
- https://wikitech.wikimedia.org/wiki/Grafana.wikimedia.org
- "Grafana Labs Contributor License Agreement". Retrieved 2021-01-22.
