Income distribution
In economics, income distribution covers how a country's total GDP is distributed amongst its population.[1] Economic theory and economic policy have long seen income and its distribution as a central concern. Classical economists such as Adam Smith (1723-1790), Thomas Malthus (1766-1834), and David Ricardo (1772-1823) concentrated their attention on factor income-distribution, that is, the distribution of income between the primary factors of production ( land, labour and capital). Modern economists have also addressed issues of income distribution, but have focussed more on the distribution of income across individuals and households. Important theoretical and policy concerns include the balance between income inequality and economic growth, and their often inverse relationship.[2]
The Lorenz curve can represent the distribution of income within a society. The Lorenz curve is closely associated with measures of income inequality, such as the Gini coefficient.
Measurement
The concept of inequality is distinct from that of poverty[3] and fairness. Income inequality metrics (or income distribution metrics) are used by social scientists to measure the distribution of income, and economic inequality among the participants in a particular economy, such as that of a specific country or of the world in general. While different theories may try to explain how income inequality comes about, income inequality metrics simply provide a system of measurement used to determine the dispersion of incomes.
Causes of income inequality
Causes of income inequality and of levels of equality/inequality include: tax policies, other economic policies, labor union policies, Federal Reserve monetary policies & fiscal policies, the market for labor, abilities of individual workers, technology and automation, education, globalization, gender bias, racism, and culture.
Distribution measurement internationally
Using Gini coefficients, several organizations, such as the United Nations (UN) and the US Central Intelligence Agency (CIA), have measured income inequality by country. The Gini index is also widely used within the World Bank.[4] It is an accurate and reliable index for measuring income distribution on a country by country level. The Gini index measurements go from 0 to 1 for 1 being perfect inequality and 0 being perfect equality. The world Gini index is measured at 0.52 as of 2016.[5]
.svg.png.webp) 2014 World Gini Index
2014 World Gini Index
The World Inequality Lab at the Paris School of Economics published in December 2017 the World Inequality Report 2018 that provides estimates of global income and wealth inequality.[6]
Trends
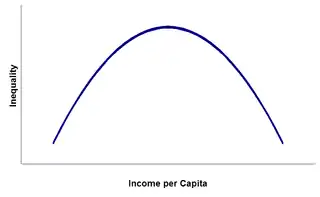
Standard economic theory stipulates that inequality tends to increase over time as a country develops, and to decrease as a certain average income is attained. This theory is commonly known as the Kuznets curve after Simon Kuznets. However, many prominent economists disagree with the need for inequality to increase as a country develops. Further, empirical data on the proclaimed subsequent decrease of inequality is conflicting.
There are two ways of looking at income inequality, within country inequality (intra-country inequality) – which is inequality within a nation; or between country inequality (inter-country inequality) which is inequality between countries.
According to intra-country inequality at least in the OECD countries, a May 2011 report by OECD stated that the gap between rich and poor within OECD countries (most of which are "high income" economies) "has reached its highest level for over 30 years, and governments must act quickly to tackle inequality".[7]
Furthermore, increased inter-country income inequality over a long period is conclusive, with the Gini coefficient (using PPP exchange rate, unweighted by population) more than doubling between 1820 and the 1980s from .20 to .52 (Nolan 2009:63).[8] However, scholars disagree about whether inter-country income inequality has increased (Milanovic 2011),[9] remained relatively stable (Bourguignon and Morrison 2002),[10] or decreased (Sala-i-Martin, 2002)[11] since 1980. What Milanovic (2005) [12] calls the “mother of all inequality disputes” emphasizes this debate by using the same data on Gini coefficient from 1950–2000 and showing that when countries’ GDP per capita incomes are unweighted by population income inequality increases, but when they are weighted inequality decreases. This has much to do with the recent average income rise in China and to some extent India, who represent almost two-fifths of the world. Notwithstanding, inter-country inequality is significant, for instance as a group the bottom 5% of US income distribution receives more income than over 68 percent of the world, and of the 60 million people that make up the top 1% of income distribution, 50 million of them are citizens of Western Europe, North America or Oceania (Milanovic 2011:116,156).[9]
In a TED presentation shown here, Hans Rosling presented the distribution and change in income distribution of various nations over the course of a few decades along with other factors such as child survival and fertility rate.
As of 2018, Albania has the smallest gap in wealth distribution with Zimbabwe having the largest gap in wealth distribution.[13]
Income distribution in different countries
Thailand
- Thailand has been ranked the world's third most unequal nation after Russia and India, with a widening gap between rich and poor according to Oxfam in 2016.[14] A study by Thammasat University economist Duangmanee Laovakul in 2013 showed that the country's top 20 land owners owned 80 percent of the nation's land. The bottom 20 owned only 0.3 percent. Among those having bank deposits, 0.1 percent of bank accounts held 49 per cent of total bank deposits.[15] As of 2019, Thai per capita income is US$8,000 a year. The government aims to raise it to US$15,000 (498,771 baht) per year, driven by average GDP growth of five to six percent. Under the 20-year national plan stretching out to 2036, the government intends to narrow the income disparity gap to 15 times, down from 20 times in 2018.[16]
Income distribution in the United States
In the United States, income has become distributed more unequally over the past 30 years, with those in the top quintile (20 percent) earning more than the bottom 80 percent combined.[17]
Income distribution in the United Kingdom
Inequality in the UK has been very high in the past, and did not change much until the onset of industrialization. Incomes used to be remarkably concentrated pre-industrial evolution: up to 40% of total income went into the pockets of the richest 5%.[18] In the more recent years income distribution is still an issue. The UK experienced a large increase in inequality during the 1980s—the incomes of the highest deciles increase while everyone else was stagnant. Uneven growth in the years leading up to 1991 meant further increases in inequality. Throughout the 1990s and 2000s, more even growth across the distribution meant little changes in inequality, with rising incomes for everybody. In sight of Brexit, there is more predicted income distribution discrepancies between wages.[19][20]
See also
References
- O'Sullivan, Arthur; Sheffrin, Steven M. (2003). Economics: Principles in Action. Upper Saddle River, New Jersey 07458: Pearson Prentice Hall. p. 348. ISBN 978-0-13-063085-8.CS1 maint: location (link)
- "Redistribution, Inequality,and Growth | Data" (PDF). imf.org. p. 25-26. Retrieved 18 August 2020.
[...] inequality continues to be a robust and powerful determinant both of the pace of medium-term growth and of the duration of growth spells, even controlling for the size of redistributive transfers. [...] [T]here is surprisingly little evidence for the growth-destroying effects of fiscal redistribution at a macroeconomic level. [...] [F]or non-extreme redistributions, there is no evidence of any adverse direct effect. The average redistribution, and the associated reduction in inequality, is thus associated with higher and more durable growth.
- For poverty see FGT metrics.
- "GINI index (World Bank estimate) | Data". data.worldbank.org. Retrieved 2016-12-04.
- root (2008-08-10). "Gini Index". Investopedia. Retrieved 2016-12-04.
- [wir2018.wid.world Dedicated website for World Inequality Report 2018]
- Society: Governments must tackle record gap between rich and poor, says OECD
- Nolan, P., 2009. Crossroads: The End of Wild Capitalism Marshall Cavendish: London, New York
- Milanovic, B., 2011. Haves and the Have-Nots, Basic Books: New York
- Bourguignon, François; Morrisson, Christian (2002). "Inequality Among World Citizens: 1820–1992". American Economic Review. 92 (4): 727–744. CiteSeerX 10.1.1.5.7307. doi:10.1257/00028280260344443.
- Sala-i-Martin, X., 2002. "The Disturbing "Rise" of Global Income Inequality," NBER Working Papers 8904, National Bureau of Economic Research, Inc.
- Milanovic, B., 2005. Worlds Apart: Measuring International and Global Inequality, Princeton University Press: Princeton
- November 26; Pham, 2018 Author: Luca Ventura Project Coordinator: B. "Global Finance Magazine - Wealth Distribution and Income Inequality by Country 2018". Global Finance Magazine. Retrieved 2019-10-23.
- Sukprasert, Pattramon (6 February 2017). "Thailand 'third most unequal'". Bangkok Post. Retrieved 6 February 2017.
- Chaitrong, Wichit (14 August 2019). "Government urged to help 1.2m desperately poor Thais". The Nation. Retrieved 14 August 2018.
- Theparat, Chatrudee (14 August 2018). "Steering the NESDB through transition". Bangkok Post. Retrieved 14 August 2018.
- Congressional Budget Office: Trends in the Distribution of Household Income Between 1979 and 2007. October 2011.
- Roser, Max; Ortiz-Ospina, Esteban (2013-12-05). "Income Inequality". Our World in Data.
- Roser, Max; Ortiz-Ospina, Esteban (5 December 2013). "Income Inequality". Our World in Data. Retrieved 24 October 2019.
 Material was copied from this source, which is available under a Creative Commons Attribution 4.0 International License.
- "Brexit and wage inequality: before and after". World Economic Forum. Retrieved 2019-10-23.
Further reading
- Piketty, T., & Goldhammer, A. (2014). Capital in the twenty-first century. Cambridge Massachusetts: The Belknap Press of Harvard University Press.
- Atkinson, A. B. (2015). Inequality: What can be done? Cambridge, MA: Harvard University Press.
- Baumohl, B. (2005). The secrets of economic indicators. Bernard Baumohl. 2005.
External links
| Wikimedia Commons has media related to Income distribution. |
- The World Top Income Database by Anthony Atkinson, Thomas Piketty, Emmanuel Saez, Facundo Alvaredo
- The Polarization of the U.S. Labor Market, economics.harvard.edu
- INTERNATIONAL MONETARY FUND Research Department. Inequality and Unsustainable Growth: Two Sides of the Same Coin? Prepared by Andrew G. Berg and Jonathan D. Ostry1
- The Chartbook of Income Inequality from INET at the University of Oxford by Anthony Atkinson, Salvatore Morelli, and Max Roser. (This source presents data about long-run changes in the income distribution for 25 countries over the course of more than one hundred years.)