List of countries by income equality

This is a list of countries or dependencies by income inequality metrics, including Gini coefficients. The Gini coefficient is a number between 0 and 1, where 0 corresponds with perfect equality (where everyone has the same income) and 1 corresponds with perfect inequality (where one person has all the incomeand everyone else has no income).

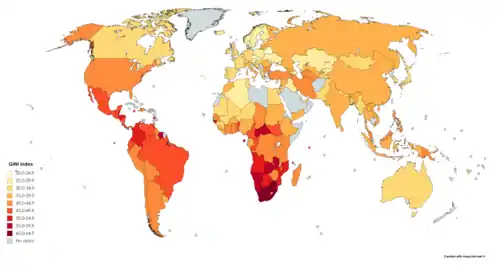
World map of the Gini coefficients by country. Based on World Bank data ranging from 1992 to 2018.[1]

Income distribution can vary greatly from wealth distribution in a country (see List of countries by distribution of wealth). Income from black market economic activity is not included and is the subject of current economic research.[2][3]

UN, World Bank and CIA list – income ratios and Gini indices

Click sorting buttons to sort alphabetically or numerically. Can sort in ascending or descending order. The row number column on the left is fixed.

Key:

R/P 10%
The ratio of the average income of the richest 10% to the poorest 10%.
R/P 20%
The ratio of the average income of the richest 20% to the poorest 20%.
Gini
Gini index, a quantified representation of a nation's Lorenz curve. A Gini index of 0% expresses perfect equality, while index of 100% expresses maximal inequality.
UN
Data from the United Nations Development Programme.
World Bank
Data from the World Bank.
CIA
Data from the Central Intelligence Agency's The World Factbook.


Row
1
2
3
4
5
6
7
8
9
10
11
12
13
14
15
16
17
18
19
20
21
22
23
24
25
26
27
28
29
30
31
32
33
34
35
36
37
38
39
40
41
42
43
44
45
46
47
48
49
50
51
52
53
54
55
56
57
58
59
60
61
62
63
64
65
66
67
68
69
70
71
72
73
74
75
76
77
78
79
80
81
82
83
84
85
86
87
88
89
90
91
92
93
94
95
96
97
98
99
100
101
102
103
104
105
106
107
108
109
110
111
112
113
114
115
116
117
118
119
120
121
122
123
124
125
126
127
128
129
130
131
132
133
134
135
136
137
138
139
140
141
142
143
144
145
146
147
148
149
150
151
152
153
154
155
156
157
158
159
160
161
162
163
164
165
166
167
168
169
170
171
172
173
174
175
176
177


Country
UN R/P World Bank Gini[4] CIA R/P[5] CIA Gini[6]
10%[7] 20%[8] % Year 10% Year % Year
 Afghanistan
 Albania7.24.233.220177.2200426.92012 est.
 Algeria9.64.027.620119.6199535.31995
 Angola9.051.32018
 Argentina31.68.841.4201835.02007 Jan.–Mar.41.72017
 Armenia8.05.034.4201825.8200430.32012
 Australia12.56.334.4201412.7199430.32008
 Austria6.94.929.720176.8200426.32007
 Azerbaijan9.726.620059.5200133.72008
 Bahrain
 Bangladesh7.54.832.420167.52000 est.32.12010
 Belarus6.93.625.220186.9200226.52011
 Belgium8.24.227.420178.3200025.92013 est.
 Belize28.853.3199919.9201349.82014
 Benin9.416.347.820159.4200336.52003
 Bhutan6.637.4201738.72012
 Bolivia93.911.842.22018157.3200246.62012
 Bosnia and Herzegovina5.45.433.020115.5200136.22007
 Botswana43.015.053.3201560.92009
 Brazil16.521.153.9201816.3201348.82018
 Bulgaria7.07.340.420178.8200535.42012
 Burkina Faso11.65.335.3201411.5200339.52007
 Burundi19.36.738.6201319.3199842.41998
 Cambodia12.212.0200437.92008 est.
 Cameroon15.711.546.6201415.4200144.62001
 Canada9.46.233.820139.5200032.12005
 Cabo Verde10.747.22007
 Central African Republic69.218.556.2200868.1199343.62003
 Chad10.043.3201143.32011 est.
 Chile26.211.244.4201732.1200352.12009
 China21.610.238.5201621.8200446.52016
 Colombia60.413.450.4201856.3200853.52012
 Comoros11.245.3201455.92004 est.
 DR Congo8.842.12012
 Congo, Republic of the12.848.92011
 Costa Rica23.412.348.0201837.3200350.32009
 Côte d'Ivoire16.68.441.5201517.0200241.52008
 Croatia7.35.330.420177.22003 est.32.02010
 Cuba
 Cyprus5.331.4201732.42013 est.
 Czech Republic5.23.724.920175.2199624.92012
 Denmark8.14.028.7201712.02000 est.24.82011 est.
 Djibouti8.844.6201740.92002
 Dominican Republic25.310.543.7201818.8201245.72012 est.
 Ecuador35.210.745.4201817.52006 Oct.[9]48.52013 Dec.[9]
 Egypt8.04.631.520178.0200030.82008
 El Salvador38.67.038.6201855.4200246.92007
 Equatorial Guinea
 Estonia10.85.430.4201711.0200332.92013
 Eswatini25.114.254.6201625.4200150.42001
 Ethiopia6.67.135.020156.5200033.02011
 European Union8.62015 est.30.62012 est.
 Fiji6.036.72013
 Finland5.63.927.420175.7200026.82008
 France9.15.231.620178.3200430.12013
 Gabon7.438.02017
 The Gambia20.25.935.9201520.6199850.21998
 Georgia15.47.136.4201815.2200346.02011
 Germany6.95.131.920166.9200027.02006
 Ghana14.110.343.5201613.7199942.32012–2013
 Greece10.27.134.4201710.42000 est.34.42013 est.
 Guatemala33.911.948.3201448.2200255.12007
 Guinea10.55.533.7201221.6200639.42007
 Guinea-Bissau19.012.650.7201084.81991
 Guyana44.6199826.0199944.62007
 Haiti54.48.641.1201268.1200160.82012
 Honduras59.417.152.1201835.2200357.72007
 Hong Kong17.853.92016
 Hungary5.54.930.620175.6200224.72009
 Iceland4.026.8201528.02006
 India8.65.537.820118.6200435.12011
 Indonesia7.86.639.020187.9200238.82018
 Iran17.27.740.8201716.9199844.52006
 Iraq4.429.52012
 Ireland9.45.032.820169.4200033.92010
 Israel13.48.539.0201611.8200537.62012
 Italy11.67.035.9201711.7200031.92012 est.
 Jamaica17.345.5200417.0200445.52004
 Japan4.55.432.920134.5199337.92011
 Jordan11.35.233.7201011.3200339.72007
 Kazakhstan8.53.827.520178.02004 est.28.92011
 Kenya13.67.740.8201518.6200042.52008 est.
 North Korea
 South Korea7.85.331.620125.9201134.12015
 Kosovo[lower-alpha 1]29.02017
 Kuwait
 Kyrgyzstan6.43.827.720186.4200333.42007
 Laos8.35.936.420128.4200236.72008
 Latvia11.65.835.6201711.6200335.22010
 Lebanon5.131.82011
 Lesotho39.820.844.9201748.22002 est.63.21995
 Liberia12.85.935.32016
 Libya
 Lithuania10.47.237.3201710.3200335.52009
 Luxembourg5.734.920176.8200030.42013 est.
 Macau352013
 North Macedonia12.57.334.2201712.3200343.62013
 Madagascar19.28.742.6201219.3200147.52001
 Malawi10.98.144.7201611.0200439.02004
 Malaysia22.18.241.0201528.02003 est.46.22009
 Maldives7.031.3201637.42004 est.
 Mali12.55.233.0200912.6200140.12001
 Malta4.529.2201727.92013
 Mauritania12.05.432.6201411.8200039.02000
 Mauritius5.936.8201735.92012 est.
 Mexico21.68.845.4201824.6200448.32008
 Micronesia8.440.1201361.12013 est.
 Moldova8.23.625.720188.3200333.02010
 Mongolia8.25.132.720188.2200236.52008
 Montenegro4.839.0201526.22013 est.
 Morocco11.77.039.5201311.9199940.92007 est.
 Mozambique18.814.254.0201418.8200245.62008
 Myanmar6.330.7201711.61998
 Namibia106.622.859.12015129.0200359.72010
 Nepal15.85.032.8201015.6200432.82010
 Netherlands9.24.228.520179.2199925.12013
 New Zealand12.436.21997
 Nicaragua31.010.246.2201415.4200140.52010
 Niger46.05.434.3201444.3199534.02007
 Nigeria17.89.135.1202017.5200343.72003
 Norway6.14.127.020176.0200026.82010
 Oman
 Pakistan6.54.833.520156.6200229.62011 FY
 Panama49.915.949.2201861.4200351.92010 est.
 Papua New Guinea23.89.341.9200923.8199650.91996
 Paraguay38.811.746.2201865.9200353.22009
 Peru26.110.342.8201831.5200345.32012
 Philippines15.57.244.4201515.5200346.02012
 Poland8.84.629.720178.7200234.12009
 Portugal15.06.433.820179.21995 est.34.22013 est.
 Qatar
 Romania7.58.036.020177.4200327.32012
 Russia12.76.637.5201812.82002422012
 Rwanda18.68.543.7201618.2200046.82000
 Sao Tome and Principe4.756.32017
 Saudi Arabia
 Senegal12.37.740.3201112.4200140.32011
 Serbia4.236.2201738.72014 est.
 Seychelles9.846.82013
 Sierra Leone87.25.435.7201887.2198934.02011
 Singapore17.717.3199846.42014
 Slovakia6.74.125.220166.7199625.32012
 Slovenia5.93.724.220175.9199823.72012
 Somalia
 South Africa33.128.463.0201431.9200062.52013 est.
 South Sudan13.046.3200946.02010 est.
 Spain10.37.334.7201710.2200034.02011
 Sri Lanka11.16.839.8201636.12003/04 FY49.02010
 St. Lucia6.851.22016
 Sudan6.235.42009
 Suriname57.61999
 Sweden6.24.628.820176.2200024.92013
 Switzerland9.05.232.720178.9200028.72012 est.
 Syria35.82004
 Taiwan6.12002 est.33.82012
 Tajikistan7.85.634.020157.8200332.62006
 Tanzania9.26.240.520179.3200037.62007
 Thailand12.66.036.4201812.4200239.42010
 Timor-Leste4.128.7201431.92007 est.
 Togo9.743.12015
 Trinidad and Tobago12.940.31992
 Tunisia13.45.232.8201513.7200040.02005 est.
 Turkey6.68.541.9201817.1200340.22010
 Turkmenistan12.340.8199912.2199840.81998
 Uganda16.68.242.8201616.4200239.52013
 Ukraine5.93.526.120187.6200628.22009
 United Arab Emirates32.52014
 United Kingdom13.85.434.8201613.6199932.42012
 United States18.59.441.4201614.02014 est.47.02014
 Uruguay11.87.839.7201817.9200345.32010
 Uzbekistan10.635.3200310.6200336.82003
 Venezuela18.815.846.9200650.3200339.02011
 Vietnam6.96.235.7201810.0200437.62008
 Palestine5.633.72016
 Yemen8.66.136.720148.6200337.72005
 Zambia21.157.1201557.52010
 Zimbabwe8.644.3201750.12006
 World12.02002 est.38.02007

Other estimates for the World: Gini = 63.0 in 2006 (Lafuente et al., 2006).[10]

EU27 countries

European Union member states' Gini coefficients, according to Eurostat:[11]


1
2
3
4
5
6
7
8
9
10
11
12
13
14
15
16
17
18
19
20
21
22
23
24
25
26
27
28
29


Member state
2011 2012 2013 2014 2015 2016 2017 2018 2019

 Austria 27.427.627.027.627.227.2 27.9 26.8 27.5
 Belgium 26.326.525.925.926.226.3 26.1 25.7 25.1
 Bulgaria 35.033.635.435.437.037.7 40.2 39.6 40.8
 Croatia 31.230.930.930.230.429.8 29.9 29.7 29.2
 Cyprus 29.231.032.434.833.632.1 30.8 29.1 31.1
 Czech Republic 25.224.924.625.125.025.1 24.5 24.0 24.0
 Denmark 26.626.526.827.727.427.7 27.6 27.8 27.5
 Estonia 31.932.532.935.634.832.7 31.6 30.6 30.5
 Finland 25.825.925.425.625.225.4 25.3 25.9 26.2
 France 30.830.530.129.229.229.3 28.8 28.5
 Germany 29.028.329.730.730.129.5 29.1 31.1 29.7
 Greece 33.534.334.434.534.234.3 33.4 32.3 31.0
 Hungary 26.927.228.328.628.228.2 28.1 28.7 28.0
 Ireland 29.830.430.731.129.729.6 30.6 28.9
 Italy 32.532.432.832.432.433.1 32.7 33.4
 Latvia 35.135.735.235.535.434.5 34.5 35.6 35.2
 Lithuania 33.032.034.635.037.937.0 37.6 36.9 35.4
 Luxembourg 27.228.030.428.728.529.6 29.2 31.3 32.3
 Malta 27.227.128.027.728.128.6 28.2 28.7 28.0
 Netherlands 25.825.425.126.226.726.9 27.1 27.4 26.8
 Poland 31.130.930.730.830.629.8 29.2 27.8 28.5
 Portugal 34.234.534.234.534.033.9 33.5 32.1 31.9
 Romania 33.534.034.635.037.434.7 33.1 35.1 34.8
 Slovakia 25.725.324.226.123.724.3 23.2 20.9
 Slovenia 23.823.724.425.024.524.4 23.7 23.4 23.9
 Spain 34.034.233.734.734.634.5 34.1 33.2 33.0
 Sweden 26.026.026.026.926.727.6 28.0 27.0 27.6
 Serbia[n 1] 38.038.340.039.8 37.6 35.6
 Montenegro[n 2][12] 38.536.536.536.5 36.7
 European Union 30.530.430.630.930.830.6 30.3 30.4
Eurozone (EA19) 30.630.530.731.030.730.7 30.4 30.6

OECD countries

Gini coefficient, before taxes and transfers

Gini coefficient, before taxes and transfers[13]


Row
1
2
3
4
5
6
7
8
9
10
11
12
13
14
15
16
17
18
19
20
21
22
23
24
25
26
27
28
29
30
31
32
33
34


Country
mid-70smid-80s~ 1990mid-90s~ 2000mid-2000sLate 2000s

 Australia0.4670.4760.4650.468
 Austria0.4330.472
 Belgium0.4490.4720.4640.4940.469
 Canada0.3850.3950.4030.4300.4400.4360.441
 Chile0.4410.4140.426
 Czech Republic0.4420.4720.4740.444
 Denmark0.3730.3960.4170.4150.4170.416
 Estonia0.5040.458
 Finland0.3430.3870.4790.4780.4830.465
 France0.3800.3700.4730.4900.4850.483
 Germany0.4390.4290.4590.4710.4990.504
 Greece0.4480.4260.4460.4660.4540.436
 Hungary0.4520.4960.4630.4970.466
 Iceland0.3650.382
 Ireland
 Israel0.4720.4760.4940.5040.5130.498
 Italy0.4200.4370.5080.5160.5570.534
 Japan0.3450.4030.4320.4430.462
 Luxembourg0.3830.4270.4210.4540.482
 Mexico0.4530.5320.5170.4910.494
 Netherlands0.4260.4730.4740.4840.4240.4260.426
 New Zealand0.4080.4680.4880.4840.4730.455
 Norway0.3510.4040.4260.4470.410
 Poland0.5420.470
 Portugal0.4570.4360.4900.4790.5420.521
 Slovakia0.4580.416
 Slovenia0.4520.423
 South Korea0.3310.344
 Spain0.461
 Sweden0.3890.4040.4080.4380.4460.4320.426
 Switzerland0.409
 Turkey0.470
 United Kingdom0.3380.4190.4390.4530.4580.4450.456
 United States0.4060.4360.4500.4770.4760.4860.486

Gini coefficient, after taxes and transfers

Gini coefficient, after taxes and transfers[13]


Row
1
2
3
4
5
6
7
8
9
10
11
12
13
14
15
16
17
18
19
20
21
22
23
24
25
26
27
28
29
30
31
32
33
34


Country
mid-70smid-80s~ 1990mid-90s~ 2000mid-2000sLate 2000s

 Australia0.3090.3170.3150.336
 Austria0.2360.2380.2520.2650.261
 Belgium0.2740.2870.2890.2710.259
 Canada0.3040.2930.2870.2890.3180.3170.324
 Chile0.4270.4030.394
 Czech Republic0.2320.2570.2600.2680.256
 Denmark0.2210.2260.2150.2260.2320.248
 Estonia0.3490.315
 Finland0.2350.2090.2180.2470.2540.259
 France0.3000.2900.2770.2870.2880.293
 Germany0.2510.2560.2660.2640.2850.295
 Greece0.4130.3360.3360.3450.3210.307
 Hungary0.2730.2940.2930.2910.272
 Iceland0.2570.301
 Ireland0.3310.3240.3040.3140.293
 Israel0.3260.3290.3380.3470.3780.371
 Italy0.3090.2970.3480.3430.3520.337
 Japan0.3040.3230.3370.3210.329
 Luxembourg0.2470.2590.2610.2580.288
 Mexico0.4520.5190.5070.4740.476
 Netherlands0.2630.2720.2920.2970.2920.2840.294
 New Zealand0.2710.3180.3350.3390.3350.330
 Norway0.2220.2430.2610.2760.250
 Poland0.3160.3490.305
 Portugal0.3540.3290.3590.3560.3850.353
 Slovakia0.2680.257
 Slovenia0.2460.236
 South Korea0.3060.315
 Spain0.3710.3370.3430.3420.3190.317
 Sweden0.2120.1980.2090.2110.2430.2340.259
 Switzerland0.2790.2760.303
 Turkey0.4340.4900.4300.409
 United Kingdom0.2680.3090.3540.3360.3510.3310.345
 United States0.3160.3370.3480.3610.3570.3800.378

See also

Notes

  1. Serbia is a negotiating candidate to the EU.
  2. Montenegro is a negotiating candidate to the EU.
  1. Kosovo is the subject of a territorial dispute between the Republic of Kosovo and the Republic of Serbia. The Republic of Kosovo unilaterally declared independence on 17 February 2008. Serbia continues to claim it as part of its own sovereign territory. The two governments began to normalise relations in 2013, as part of the 2013 Brussels Agreement. Kosovo is currently recognized as an independent state by 99 out of the 193 United Nations member states. In total, 113 UN member states recognized Kosovo at some point, of which 14 later withdrew their recognition.

References

  1. "GINI index (World Bank estimate) | Data". data.worldbank.org. Retrieved 2020-07-23.
  2. Underground economy and income inequality: two connected aspects in the oncoming context of Italian federalism Archived 2012-02-09 at the Wayback Machine. By Iacopo Odoardi and Carmen Pagliari. Vol. 15 No. 1, 2011 Archived 2012-02-09 at the Wayback Machine. Global & Local Economic Review.
  3. The Size of the Shadow Economies of 145 Countries all over the World: First Results over the Period 1999 to 2003. December 2004. By Friedrich Schneider (University of Linz and IZA Bonn). Institute for the Study of Labor.
  4. "GINI index (World Bank estimate)". data.worldbank.org. World Bank. Retrieved 30 March 2020.
  5. Data show the ratio of the household income or consumption share of the richest group to that of the poorest. Household income or consumption by percentage share (%), The World Factbook, CIA, updated on January 24, 2008. Note: To calculate the value given in the table for this article, the highest 10% value was divided by the lowest 10% value.
  6. Distribution of family income – Gini index, The World Factbook, CIA, accessed on September 24, 2020.
  7. Data show the ratio of the income or expenditure share of the richest group to that of the poorest. Human Development Report 2009, UNDP, accessed on July 30, 2011.
  8. "| Human Development Reports". hdr.undp.org. Retrieved 2019-03-04.
  9. Data for urban households only.
  10. Lafuente Lechuga, Matilde; Losa Carmona, Antonio; Sánchez Martínez, Antonio. 2016. «Análisis de la evolución de la desigualdad económica mundial en los últimos años» (pdf). XVI Jornadas de ASEPUMA y II Encuentro Internacional. Consultado el 12 de abril de 2014.
  11. "Gini coefficient of equivalised disposable income – EU-SILC survey". ec.europa.eu/eurostat/. Eurostat. Retrieved 20 October 2020.
  12. "GINI Index for Montenegro". 18 January 2018. Cite journal requires |journal= (help)
  13. OECD. "Income Distribution and Poverty : by country –I nequalityY". Archived from the original on 2015-04-02.

Further reading

This article is issued from Wikipedia. The text is licensed under Creative Commons - Attribution - Sharealike. Additional terms may apply for the media files.