La Paz, Abra
La Paz, officially the Municipality of La Paz (Ilocano: Ili ti La Paz; Tagalog: Bayan ng La Paz), is a 5th class municipality in the province of Abra, Philippines. According to the 2015 census, it has a population of 15,437 people. [3]
La Paz | |
|---|---|
| Municipality of La Paz | |
Seal | |
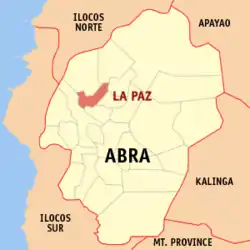 Map of Abra with La Paz highlighted | |
OpenStreetMap 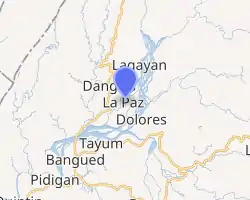
| |
.svg.png.webp) La Paz Location within the Philippines | |
| Coordinates: 17°40′29″N 120°41′11″E | |
| Country | |
| Region | Cordillera Administrative Region (CAR) |
| Province | Abra |
| District | Lone District |
| Barangays | 12 (see Barangays) |
| Government | |
| • Type | Sangguniang Bayan |
| • Mayor | Menchie B. Bernos |
| • Vice Mayor | Benito E. Nono |
| • Representative | Joseph Sto. Niño B. Bernos |
| • Electorate | 10,168 voters (2019) |
| Area | |
| • Total | 51.41 km2 (19.85 sq mi) |
| Elevation | 210 m (690 ft) |
| Population | |
| • Total | 15,437 |
| • Density | 300/km2 (780/sq mi) |
| • Households | 3,325 |
| Economy | |
| • Income class | 5th municipal income class |
| • Poverty incidence | 19.31% (2015)[4] |
| • Revenue | ₱61,203,688.67 (2016) |
| Time zone | UTC+8 (PST) |
| ZIP code | 2826 |
| PSGC | |
| IDD : area code | +63 (0)74 |
| Climate type | tropical rainforest climate |
| Native languages | Itneg Ilocano Tagalog |
Geography
La Paz is located at 17°40′29″N 120°41′11″E.
According to the Philippine Statistics Authority, the municipality has a land area of 51.41 square kilometres (19.85 sq mi) [2] constituting 1.23% of the 4,165.25-square-kilometre- (1,608.21 sq mi) total area of Abra.
Barangays
La Paz is politically subdivided into 12 barangays.[5]
| PSGC | Barangay | Population | ±% p.a. | |||
|---|---|---|---|---|---|---|
| 2015 [3] | 2010 [6] | |||||
| 140108002 | Benben (Bonbon) | 3.6% | 554 | 551 | 0.10% | |
| 140108003 | Bulbulala | 8.3% | 1,288 | 1,183 | 1.63% | |
| 140108004 | Buli | 9.9% | 1,531 | 1,453 | 1.00% | |
| 140108005 | Canan (Gapan) | 9.0% | 1,384 | 1,155 | 3.50% | |
| 140108006 | Liguis | 6.3% | 973 | 911 | 1.26% | |
| 140108007 | Malabbaga | 8.7% | 1,338 | 1,243 | 1.41% | |
| 140108008 | Mudeng | 7.5% | 1,165 | 1,153 | 0.20% | |
| 140108009 | Pidipid | 5.4% | 831 | 950 | −2.52% | |
| 140108010 | Poblacion | 22.9% | 3,538 | 3,687 | −0.78% | |
| 140108011 | San Gregorio | 8.9% | 1,374 | 1,178 | 2.97% | |
| 140108012 | Toon | 6.2% | 960 | 928 | 0.65% | |
| 140108013 | Udangan | 3.2% | 501 | 490 | 0.42% | |
| Total | 15,437 | 14,882 | 0.70% | |||
Climate
| Climate data for La Paz, Abra | |||||||||||||
|---|---|---|---|---|---|---|---|---|---|---|---|---|---|
| Month | Jan | Feb | Mar | Apr | May | Jun | Jul | Aug | Sep | Oct | Nov | Dec | Year |
| Average high °C (°F) | 29 (84) |
30 (86) |
32 (90) |
33 (91) |
32 (90) |
31 (88) |
30 (86) |
29 (84) |
30 (86) |
30 (86) |
30 (86) |
29 (84) |
30 (87) |
| Average low °C (°F) | 18 (64) |
19 (66) |
20 (68) |
22 (72) |
24 (75) |
24 (75) |
24 (75) |
24 (75) |
23 (73) |
22 (72) |
20 (68) |
19 (66) |
22 (71) |
| Average precipitation mm (inches) | 9 (0.4) |
11 (0.4) |
13 (0.5) |
23 (0.9) |
92 (3.6) |
122 (4.8) |
153 (6.0) |
137 (5.4) |
139 (5.5) |
141 (5.6) |
42 (1.7) |
14 (0.6) |
896 (35.4) |
| Average rainy days | 4.6 | 4.0 | 6.2 | 9.1 | 19.5 | 23.2 | 24.0 | 22.5 | 21.5 | 15.2 | 10.5 | 6.0 | 166.3 |
| Source: Meteoblue [7] | |||||||||||||
Demographics
|
| ||||||||||||||||||||||||||||||||||||||||||||||||
| Source: Philippine Statistics Authority [3] [6] [8][9] | |||||||||||||||||||||||||||||||||||||||||||||||||
In the 2015 census, La Paz had a population of 15,437. [3] The population density was 300 inhabitants per square kilometre (780/sq mi).
References
- Municipality of La Paz | (DILG)
- "Province: Abra". PSGC Interactive. Quezon City, Philippines: Philippine Statistics Authority. Retrieved 12 November 2016.
- Census of Population (2015). "Cordillera Administrative Region (CAR)". Total Population by Province, City, Municipality and Barangay. PSA. Retrieved 20 June 2016.
- "PSA releases the 2015 Municipal and City Level Poverty Estimates". Quezon City, Philippines. Retrieved 12 October 2019.
- "Municipal: La Paz, Abra". PSGC Interactive. Quezon City, Philippines: Philippine Statistics Authority. Retrieved 8 January 2016.
- Census of Population and Housing (2010). "Cordillera Administrative Region (CAR)". Total Population by Province, City, Municipality and Barangay. NSO. Retrieved 29 June 2016.
- "La Paz: Average Temperatures and Rainfall". Meteoblue. Retrieved 25 April 2020.
- Censuses of Population (1903–2007). "Cordillera Administrative Region (CAR)". Table 1. Population Enumerated in Various Censuses by Province/Highly Urbanized City: 1903 to 2007. NSO.
- "Province of Abra". Municipality Population Data. Local Water Utilities Administration Research Division. Retrieved 17 December 2016.
External links
| Wikimedia Commons has media related to La Paz, Abra. |
Bangued (capital) | |
| Municipalities | |
| Barangays | |
This article is issued from Wikipedia. The text is licensed under Creative Commons - Attribution - Sharealike. Additional terms may apply for the media files.