Lazi, Siquijor
Lazi, officially the Municipality of Lazi (Cebuano: Lungsod sa Lazi; Tagalog: Bayan ng Lazi), is a 4th class municipality in the province of Siquijor, Philippines. According to the 2015 census, it has a population of 20,490 people. [3]
Lazi | |
|---|---|
| Municipality of Lazi | |
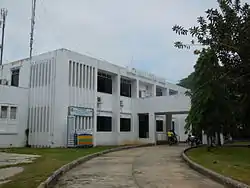 Lazi municipal hall | |
 Seal | |
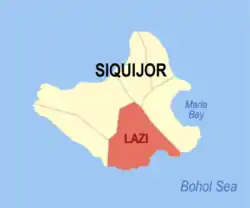 Map of Siquijor with Lazi highlighted | |
OpenStreetMap 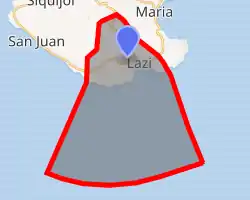
| |
.svg.png.webp) Lazi Location within the Philippines | |
| Coordinates: 9°08′N 123°37′E | |
| Country | |
| Region | Central Visayas (Region VII) |
| Province | Siquijor |
| District | Lone district of Siquijor |
| Founded | 1857 |
| Barangays | 18 (see Barangays) |
| Government | |
| • Type | Sangguniang Bayan |
| • Mayor | James D. Monte |
| • Vice Mayor | Earl A. Aljas |
| • Representative | Jake Vincent S. Villa |
| • Electorate | 15,827 voters (2019) |
| Area | |
| • Total | 70.64 km2 (27.27 sq mi) |
| Elevation | 28 m (92 ft) |
| Population | |
| • Total | 20,490 |
| • Density | 290/km2 (750/sq mi) |
| • Households | 5,001 |
| Economy | |
| • Income class | 4th municipal income class |
| • Poverty incidence | 35.77% (2015)[4] |
| • Revenue | ₱66,417,923.30 (2016) |
| Time zone | UTC+8 (PST) |
| ZIP code | 6228 |
| PSGC | |
| IDD : area code | +63 (0)35 |
| Climate type | tropical monsoon climate |
| Native languages | Cebuano Tagalog |
Lazi church is currently in the tentative list for UNESCO World Heritage Sites under the Baroque Churches of the Philippines (Extension). A proposal has been suggested by scholars to make a separate UNESCO inclusion for "Old Centre of Lazi which includes the Lazi Church".
Barangays
Lazi comprises 18 barangays:
| PSGC | Barangay | Population | ±% p.a. | |||
|---|---|---|---|---|---|---|
| 2015 [3] | 2010 [5] | |||||
| 076103001 | Campalanas | 9.7% | 1,979 | 1,873 | 1.05% | |
| 076103002 | Cangclaran | 2.6% | 539 | 533 | 0.21% | |
| 076103003 | Cangomantong | 5.3% | 1,088 | 924 | 3.16% | |
| 076103004 | Capalasanan | 5.6% | 1,145 | 1,214 | −1.11% | |
| 076103005 | Catamboan (Poblacion) | 8.0% | 1,633 | 1,617 | 0.19% | |
| 076103006 | Gabayan | 9.6% | 1,970 | 1,934 | 0.35% | |
| 076103007 | Kimba | 3.5% | 725 | 657 | 1.89% | |
| 076103008 | Kinamandagan | 4.8% | 992 | 922 | 1.40% | |
| 076103009 | Lower Cabangcalan | 4.6% | 952 | 866 | 1.82% | |
| 076103010 | Nagerong | 6.6% | 1,346 | 1,313 | 0.47% | |
| 076103011 | Po‑o | 3.4% | 704 | 711 | −0.19% | |
| 076103012 | Simacolong | 8.7% | 1,777 | 1,801 | −0.26% | |
| 076103013 | Tagmanocan | 4.5% | 927 | 853 | 1.60% | |
| 076103014 | Talayong | 3.1% | 634 | 608 | 0.80% | |
| 076103015 | Tigbawan (Poblacion) | 7.8% | 1,605 | 1,696 | −1.04% | |
| 076103016 | Tignao | 4.5% | 914 | 887 | 0.57% | |
| 076103017 | Upper Cabangcalan | 3.1% | 631 | 658 | −0.79% | |
| 076103018 | Ytaya | 4.5% | 929 | 957 | −0.56% | |
| Total | 20,490 | 20,024 | 0.44% | |||
Climate
| Climate data for Lazi, Siquijor | |||||||||||||
|---|---|---|---|---|---|---|---|---|---|---|---|---|---|
| Month | Jan | Feb | Mar | Apr | May | Jun | Jul | Aug | Sep | Oct | Nov | Dec | Year |
| Average high °C (°F) | 29 (84) |
30 (86) |
31 (88) |
32 (90) |
31 (88) |
30 (86) |
30 (86) |
30 (86) |
30 (86) |
29 (84) |
29 (84) |
29 (84) |
30 (86) |
| Average low °C (°F) | 22 (72) |
22 (72) |
22 (72) |
23 (73) |
24 (75) |
24 (75) |
24 (75) |
24 (75) |
24 (75) |
24 (75) |
23 (73) |
23 (73) |
23 (74) |
| Average precipitation mm (inches) | 26 (1.0) |
22 (0.9) |
28 (1.1) |
41 (1.6) |
95 (3.7) |
136 (5.4) |
147 (5.8) |
126 (5.0) |
132 (5.2) |
150 (5.9) |
98 (3.9) |
46 (1.8) |
1,047 (41.3) |
| Average rainy days | 7.5 | 6.7 | 8.9 | 10.4 | 21.6 | 25.6 | 26.3 | 25.0 | 24.1 | 26.2 | 19.2 | 12.1 | 213.6 |
| Source: Meteoblue [6] | |||||||||||||
Demographics
|
| ||||||||||||||||||||||||||||||||||||||||||||||||
| Source: Philippine Statistics Authority [3] [5] [7][8] | |||||||||||||||||||||||||||||||||||||||||||||||||
Gallery
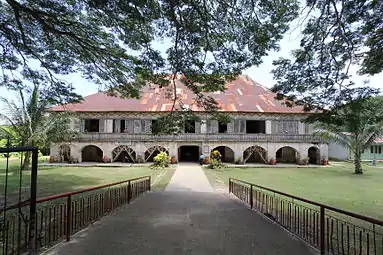 San Isidro Labrador Convent
 The century-old Enchanted Balete Tree
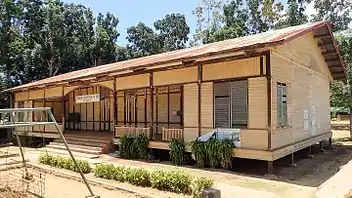 The wooden Gabaldon school
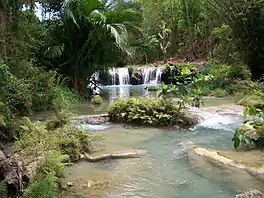 Cambugahay Falls
References
- Municipality of Lazi | (DILG)
- "Province: Siquijor". PSGC Interactive. Quezon City, Philippines: Philippine Statistics Authority. Retrieved 12 November 2016.
- Census of Population (2015). "Region VII (Central Visayas)". Total Population by Province, City, Municipality and Barangay. PSA. Retrieved 20 June 2016.
- "PSA releases the 2015 Municipal and City Level Poverty Estimates". Quezon City, Philippines. Retrieved 12 October 2019.
- Census of Population and Housing (2010). "Region VII (Central Visayas)". Total Population by Province, City, Municipality and Barangay. NSO. Retrieved 29 June 2016.
- "Lazi: Average Temperatures and Rainfall". Meteoblue. Retrieved 28 April 2020.
- Censuses of Population (1903–2007). "Region VII (Central Visayas)". Table 1. Population Enumerated in Various Censuses by Province/Highly Urbanized City: 1903 to 2007. NSO.
- "Province of Siquijor". Municipality Population Data. Local Water Utilities Administration Research Division. Retrieved 17 December 2016.
External links
 Media related to Lazi at Wikimedia Commons
- Lazi Profile at PhilAtlas.com
- Philippine Standard Geographic Code
Siquijor (capital) | |
| Municipalities | |
This article is issued from Wikipedia. The text is licensed under Creative Commons - Attribution - Sharealike. Additional terms may apply for the media files.