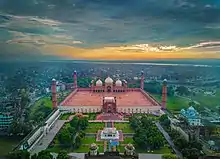
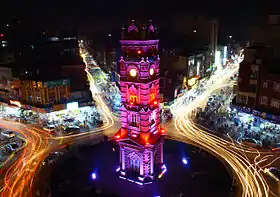
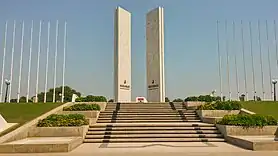
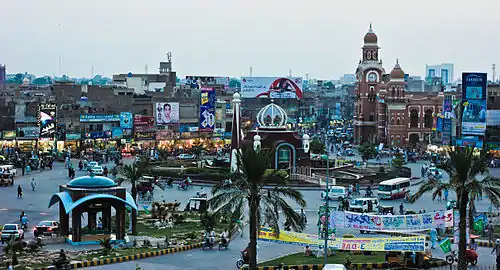
List of cities in Punjab, Pakistan by population
The following list sorts all the cities in the Pakistani province of Punjab with a population of more than 100,000 according to the 2017 Census. As of 15 March 2017, 58 cities fulfill this criterion and are listed here. This list refers only to the population of individual cities, municipalities and towns within their defined limits, which does not include other municipalities or suburban areas within Urban agglomerations.
List
The following table lists the 58 cities in Punjab with a population of at least 100,000 on 15 March 2017, according to the 2017 Census of Pakistan.[1] A city is displayed in bold if it is a state or federal capital.
| 2017 Rank |
City | 2017 census | 1998 Census | 1981 Census | 1972 Census |
|---|---|---|---|---|---|
| 1 | Lahore | 11,126,285 | 5,209,088 | 2,988,486 | 2,198,890 |
| 2 | Faisalabad | 3,204,726 | 2,008,861 | 1,104,209 | 823,343 |
| 3 | Rawalpindi | 2,098,231 | 1,409,768 | 794,843 | 614,809 |
| 4 | Gujranwala | 2,027,001 | 1,132,509 | 600,993 | 323,880 |
| 5 | Multan | 1,871,843 | 1,197,384 | 732,070 | 538,949 |
| 6 | Bahawalpur | 762,111 | 408,395 | 180,263 | 133,782 |
| 7 | Sargodha | 659,862 | 458,440 | 251,362 | 140,460 |
| 8 | Sialkot | 655,852 | 421,502 | 302,009 | 203,650 |
| 9 | Sheikhupura | 473,129 | 280,263 | 141,168 | 80,560 |
| 10 | Rahim Yar Khan | 420,419 | 233,537 | 119,036 | 74,262 |
| 11 | Jhang | 414,131 | 293,366 | 195,558 | 131,843 |
| 12 | Dera Ghazi Khan | 399,064 | 190,542 | 102,007 | 72,343 |
| 13 | Gujrat | 390,533 | 251,792 | 155,058 | 100,333 |
| 14 | Sahiwal | 389,605 | 208,778 | 150,954 | 106,648 |
| 15 | Wah Cantonment | 380,103 | 198,891 | 122,335 | 107,510 |
| 16 | Kasur | 358,409 | 245,321 | 155,523 | 101,295 |
| 17 | Okara | 357,935 | 201,815 | 127,455 | 84,334 |
| 18 | Chiniot | 278,747 | 172,522 | 105,559 | 70,108 |
| 19 | Kamoke | 249,767 | 152,288 | 71,097 | 50,257 |
| 20 | Hafizabad | 245,784 | 133,678 | 83,464 | 61,597 |
| 21 | Sadiqabad | 239,677 | 144,391 | 63,935 | 37,121 |
| 22 | Burewala | 231,797 | 152,097 | 86,311 | 57,741 |
| 23 | Khanewal | 227,059 | 133,986 | 89,090 | 67,746 |
| 24 | Muzaffargarh | 209,604 | 123,404 | 53,192 | 24,736 |
| 25 | Mandi Bahauddin | 198,609 | 99,496 | 44,796 | 36,172 |
| 26 | Jhelum | 190,425 | 147,392 | 106,462 | 70,157 |
| 27 | Khanpur | 184,793 | 120,382 | 70,589 | 49,235 |
| 28 | Pakpattan | 176,693 | 109,033 | 69,820 | 42,028 |
| 29 | Daska | 175,170 | 102,883 | 55,555 | 34,487 |
| 30 | Gojra | 174,860 | 117,892 | 68,000 | 41,975 |
| 31 | Muridke | 166,652 | 111,951 | 35,419 | 18,507 |
| 32 | Bahawalnagar | 161,033 | 111,313 | 74,533 | 50,991 |
| 33 | Samundri | 156,991 | 54,908 | 30,849 | 13,642 |
| 34 | Jaranwala | 150,380 | 106,985 | 69,459 | 46,494 |
| 35 | Chishtian | 149,939 | 102,287 | 61,959 | 38,496 |
| 36 | Attock | 146,396 | 69,729 | 39,986 | 29,172 |
| 37 | Vehari | 145,464 | 94,343 | 53,799 | 28,246 |
| 38 | Kot Abdul Malik | 143,434 | 63,525 | ... | ... |
| 39 | Ferozewala | 141,405 | 55,433 | ... | ... |
| 40 | Chakwal | 138,146 | 80,508 | 43,670 | 29,143 |
| 41 | Gujranwala Cantonment | 137,302 | 93,093 | 57,760 | 36,598 |
| 42 | Kamalia | 135,641 | 97,324 | 61,107 | 50,934 |
| 43 | Ahmedpur East | 133,369 | 96,415 | 56,979 | 43,312 |
| 44 | Kot Addu | 129,703 | 80,720 | 37,479 | 21,409 |
| 45 | Wazirabad | 128,060 | 90,197 | 62,725 | 40,063 |
| 46 | Layyah | 126,361 | 72,319 | 51,482 | 33,549 |
| 47 | Taxila | 121,952 | 71,882 | 38,374 | ... |
| 48 | Khushab | 119,384 | 87,859 | 56,274 | 43,391 |
| 49 | Mianwali | 118,883 | 80,171 | 59,159 | 48,304 |
| 50 | Lodhran | 117,851 | 65,501 | 21,791 | 14,232 |
| 51 | Hasilpur | 115,536 | 71,295 | 37,026 | 15,742 |
| 52 | Bhakkar | 113,018 | 68,896 | 41,934 | 34,638 |
| 53 | Arif Wala | 111,403 | 74,174 | 43,654 | 28,171 |
| 54 | Sambrial | 109,479 | 49,574 | 24,432 | 14,300 |
| 55 | Jatoi | 109,424 | 38,986 | 21,422 | 8,068 |
| 56 | Haroonabad | 107,858 | 62,878 | 42,590 | 35,189 |
| 57 | Narowal | 103,067 | 57,052 | 35,125 | 22,174 |
| 58 | Bhalwal | 100,135 | 61,523 | 35,434 | 13,093 |
References
- "DISTRICT WISE CENSUS RESULTS CENSUS 2017" (PDF). www.pbscensus.gov.pk. Archived from the original (PDF) on 29 August 2017.
This article is issued from Wikipedia. The text is licensed under Creative Commons - Attribution - Sharealike. Additional terms may apply for the media files.
