Magdeburg (electoral district)
Magdeburg is an electoral constituency (German: Wahlkreis) represented in the Bundestag. It elects one member via first-past-the-post voting. Under the current constituency numbering system, it is designated as constituency 69. It is located in central Saxony-Anhalt, comprising the city of Magdeburg and northeastern parts of Salzlandkreis district.[1]
| 69 Magdeburg | |
|---|---|
| electoral district for the Bundestag | |
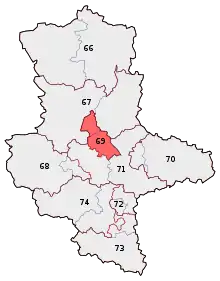 Magdeburg in 2013 | |
| State | Saxony-Anhalt |
| Population | 292,400 (2015) |
| Electorate | 238,060 (2017) |
| Major settlements | Magdeburg Schönebeck |
| Area | 588.6 km2 |
| Current electoral district | |
| Created | 1990 |
| Party | CDU |
| Member | Tino Sorge |
| Elected | 2013, 2017 |
Magdeburg was created for the inaugural 1990 federal election after German reunification. Since 2013, it has been represented by Tino Sorge of the Christian Democratic Union (CDU).[2]
Geography
Magdeburg is located in central Saxony-Anhalt. As of the 2021 federal election, it comprises the independent city of Magdeburg as well as the municipalities of Barby, Bördeland, Calbe, and Schönebeck from the Salzlandkreis district.[1]
History
Magdeburg was created after German reunification in 1990. In the 1990 through 1998 elections, it was constituency 286 in the numbering system. In the 2002 and 2005 elections, it was number 69. In the 2009 election, it was number 70. Since the 2013 election, it has been number 69.
Originally, the constituency comprised the city of Magdeburg without the quarters of Buckau, Fermersleben, Salbke, Westerhüsen, Leipziger Straße, Hopfengarten, and Reform. In the 2002 and 2005 elections, it was coterminous with the city of Magdeburg. In the 2009 election, it acquired the area of the former Schönebeck district, now part of Salzlandkreis district. The constituency acquired its current borders in the 2013 election.
| Election | No. | Name | Borders |
|---|---|---|---|
| 1990 | 286 | Magdeburg | |
| 1994 | |||
| 1998 | |||
| 2002 | 69 |
| |
| 2005 | |||
| 2009 | 70 |
| |
| 2013 | 69 |
| |
| 2017 | |||
| 2021 |
Members
The constituency was first represented by Klaus Mildner of the Christian Democratic Union (CDU) from 1990 to 1994. Uwe Küster of the Social Democratic Party (SPD) was elected in 1994 and served until 2009. In the 2009 election, Rosemarie Hein of The Left was elected representative. Tino Sorge of the CDU was elected in 2013, and re-elected in 2017.
| Election | Member | Party | % | |
|---|---|---|---|---|
| 1990 | Klaus Mildner | CDU | 34.5 | |
| 1994 | Uwe Küster | SPD | 36.2 | |
| 1998 | 45.5 | |||
| 2002 | 47.7 | |||
| 2005 | 40.8 | |||
| 2009 | Rosemarie Hein | LINKE | 32.0 | |
| 2013 | Tino Sorge | CDU | 36.3 | |
| 2017 | 27.4 | |||
Election results
2017 election
| Federal election (2017): Magdeburg[3] | |||||||||
|---|---|---|---|---|---|---|---|---|---|
| Notes: |
Blue background denotes the winner of the electorate vote.
| ||||||||
| Party | Candidate | Votes | % | ±% | Party votes | % | ±% | ||
| CDU | 44,021 | 27.4 | 44,616 | 27.8 | |||||
| SPD | Burkhard Lischka | 34,877 | 21.7 | 27,513 | 17.1 | ||||
| Left | Eva von Angern | 30,299 | 18.9 | 30,056 | 18.7 | ||||
| AfD | Frank Pasemann | 24,509 | 15.3 | 26,051 | 16.2 | ||||
| FDP | Karl-Heinz Paqué | 10,796 | 6.7 | 12,713 | 7.9 | ||||
| Green | Matthias Borowiak | 6,417 | 4.0 | 8,564 | 5.3 | ||||
| Tierschutzallianz | Bettina Fassl | 4,102 | 2.6 | 3,254 | 2.0 | ||||
| MG | Marcel Guderjahn | 2,570 | 1.6 | 1,672 | 1.0 | ||||
| PARTEI | 2,504 | 1.6 | |||||||
| FW | Karlheinz Körner | 1,739 | 1.1 | 1,282 | 0.8 | ||||
| DiB | 793 | 0.5 | |||||||
| NPD | Gustav Haenschke | 765 | 0.5 | 937 | 0.6 | ||||
| BGE | 528 | 0.3 | |||||||
| MLPD | Daniel Wiegenstein | 461 | 0.3 | 294 | 0.2 | ||||
| Informal votes | 2,338 | 2,117 | |||||||
| Total Valid votes | 160,556 | 160,777 | |||||||
| Turnout | 162,894 | 68.4 | |||||||
| CDU hold | Majority | 9,144 | 5.7 | ||||||
2013 election
| Federal election (2013): Magdeburg[4] | |||||||||
|---|---|---|---|---|---|---|---|---|---|
| Notes: |
Blue background denotes the winner of the electorate vote.
| ||||||||
| Party | Candidate | Votes | % | ±% | Party votes | % | ±% | ||
| CDU | Tino Sorge | 55,046 | 36.3 | 56,982 | 37.5 | ||||
| Left | 38,231 | 25.2 | 36,473 | 24.0 | |||||
| SPD | Burkhard Lischka | 38,153 | 25.2 | 31,763 | 20.9 | ||||
| AfD | 6,355 | 4.2 | |||||||
| Green | Stephan Bischoff | 6,073 | 4.0 | 8,490 | 5.6 | ||||
| Pirates | Jörg Schulenburg | 4,153 | 2.7 | 3,654 | 2.4 | ||||
| NPD | Gustav Walter Haenschke | 2,786 | 1.8 | 2,272 | 1.5 | ||||
| Tierschutzpartei | 2,758 | 1.8 | |||||||
| FDP | Sven Fricke | 2,090 | 1.4 | 3,687 | 2.4 | ||||
| FW | Christian Heimann | 1,875 | 1.2 | 1,256 | 0.8 | ||||
| PRO | 466 | 0.3 | |||||||
| MLPD | Daniel Wiegenstein | 403 | 0.3 | 280 | 0.2 | ||||
| ÖDP | 348 | 0.2 | |||||||
| Informal votes | 2,836 | 2,378 | |||||||
| Total Valid votes | 151,568 | 152,026 | |||||||
| Turnout | 154,404 | 63.2 | |||||||
| CDU gain from Left | Majority | 16,815 | 11.1 | ||||||
2009 election
| Federal election (2009): Magdeburg[5] | |||||||||
|---|---|---|---|---|---|---|---|---|---|
| Notes: |
Blue background denotes the winner of the electorate vote.
| ||||||||
| Party | Candidate | Votes | % | ±% | Party votes | % | ±% | ||
| Left | Rosemarie Hein | 48,069 | 32.0 | 48,333 | 32.1 | ||||
| CDU | Bernd Heynemann | 46,481 | 31.0 | 42,150 | 28.0 | ||||
| SPD | Burkhard Lischka | 32,844 | 21.9 | 28,217 | 18.8 | ||||
| FDP | Ulrich Koehler | 9,890 | 6.6 | 13,801 | 9.2 | ||||
| Green | Dorothea Frederking | 8,637 | 5.8 | 10,281 | 6.8 | ||||
| Pirates | 4,605 | 3.1 | |||||||
| NPD | Matthias Gärtner | 2,618 | 1.7 | 2,275 | 1.5 | ||||
| Independent | Eva-Maria Godau | 851 | 0.6 | ||||||
| MLPD | Daniel Wiegenstein | 626 | 0.4 | 410 | 0.3 | ||||
| DVU | 294 | 0.2 | |||||||
| Informal votes | 2,932 | 2,582 | |||||||
| Total Valid votes | 150,016 | 150,366 | |||||||
| Turnout | 152,948 | 60.1 | |||||||
| Left gain from SPD | Majority | 1,588 | 1.0 | ||||||
References
- "Constituency Magdeburg". Federal Returning Officer.
- "Results for Magdeburg". Federal Returning Officer.
- Results for Magdeburg
- Results for Magdeburg
- Results for Magdeburg
| Current | |
|---|---|
| Other states |
|
| See also | |