Matplotlib
Matplotlib is a plotting library for the Python programming language and its numerical mathematics extension NumPy. It provides an object-oriented API for embedding plots into applications using general-purpose GUI toolkits like Tkinter, wxPython, Qt, or GTK+. There is also a procedural "pylab" interface based on a state machine (like OpenGL), designed to closely resemble that of MATLAB, though its use is discouraged.[3] SciPy makes use of Matplotlib.
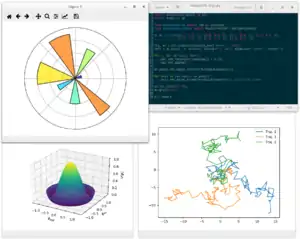 Screenshot of Matplotlib plots and code | |
| Original author(s) | John D. Hunter |
|---|---|
| Developer(s) | Michael Droettboom, et al. |
| Initial release | 2003[1] |
| Stable release | 3.3.3[2]
/ 12 November 2020 |
| Repository | |
| Written in | Python |
| Engine |
|
| Operating system | Cross-platform |
| Type | Plotting |
| License | Matplotlib license |
| Website | matplotlib |
Matplotlib was originally written by John D. Hunter. Since then it has an active development community[4] and is distributed under a BSD-style license. Michael Droettboom was nominated as matplotlib's lead developer shortly before John Hunter's death in August 2012[5] and was further joined by Thomas Caswell.[6][7]
Matplotlib 2.0.x supports Python versions 2.7 through 3.6. Python 3 support started with Matplotlib 1.2. Matplotlib 1.4 is the last version to support Python 2.6.[8] Matplotlib has pledged not to support Python 2 past 2020 by signing the Python 3 Statement.[9]
Comparison with MATLAB
Pyplot is a Matplotlib module which provides a MATLAB-like interface.[10] Matplotlib is designed to be as usable as MATLAB, with the ability to use Python, and the advantage of being free and open-source.
Examples
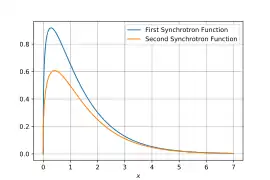 Line plot
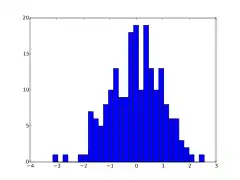 Histogram
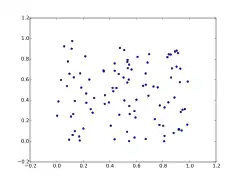 Scatter plot
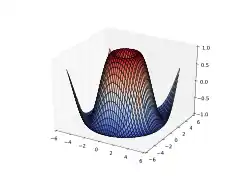 3D plot
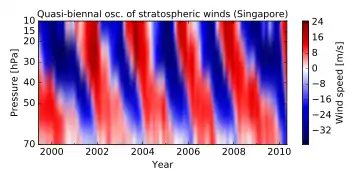 Image plot
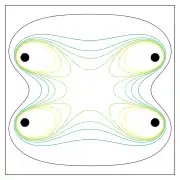 Contour plot
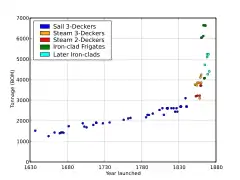 Scatter plot
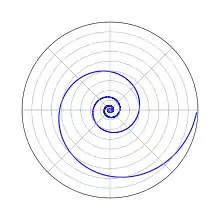 Polar plot
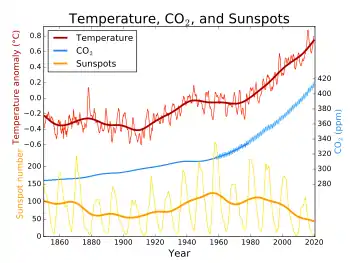 Line plot
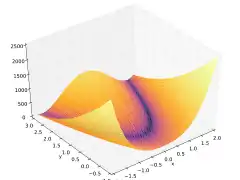 3-D plot
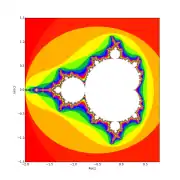 Image plot
Toolkits
Several toolkits are available which extend Matplotlib functionality. Some are separate downloads, others ship with the Matplotlib source code but have external dependencies.[11]
- Basemap: map plotting with various map projections, coastlines, and political boundaries[12]
- Cartopy: a mapping library featuring object-oriented map projection definitions, and arbitrary point, line, polygon and image transformation capabilities.[13] (Matplotlib v1.2 and above)
- Excel tools: utilities for exchanging data with Microsoft Excel
- GTK tools: interface to the GTK+ library
- Qt interface
- Mplot3d: 3-D plots
- Natgrid: interface to the natgrid library for gridding irregularly spaced data.
- matplotlib2tikz: export to Pgfplots for smooth integration into LaTeX documents[14]
- Seaborn: provides an API on top of Matplotlib that offers sane choices for plot style and color defaults, defines simple high-level functions for common statistical plot types, and integrates with the functionality provided by Pandas
Related projects
- Biggles[15]
- Chaco[16]
- DISLIN
- GNU Octave
- Gnuplot-py[17]
- PLplot – Python bindings available
PyCha[18] – libcairo implementationPyPlotter[19] – compatible with Jython- SageMath – uses
Matplotlibto draw plots - SciPy (modules
pltandgplt) - wxPython (module
wx.lib.plot.py) - Plotly – for interactive, online Matplotlib and Python graphs
- Bokeh[20] – Python interactive visualization library that targets modern web browsers for presentation
References
- "Copyright Policy".
- "Release 3.3.3". 12 November 2020. Retrieved 14 November 2020.
- "Matplotlib coding styles". matplotlib.org.
- "Matplotlib github stats". matplotlib.org.
- "Announcing Michael Droettboom as the lead Matplotlib developer". matplotlib.org.
- "Matplotlib Lead Developer Explains Why He Can't Fix the Docs—But You Can – NumFOCUS". NumFOCUS. 2017-10-05. Retrieved 2018-04-11.
- "Credits – Matplotlib 2.2.2 documentation". matplotlib.org. Retrieved 2018-04-11.
- "Installing – Matplotlib 2.0.2 documentation". Retrieved 2017-06-23.
- "Add Matplotlib to list by takluyver · Pull Request #20 · python3statement/python3statement.github.io". GitHub. Retrieved 2018-04-11.
- "Matplotlib: Python plotting — Matplotlib 3.2.0 documentation". matplotlib.org. Retrieved 2020-03-14.
- "Toolkits". matplotlib.org.
- Whitaker, Jeffrey. "The Matplotlib Basemap Toolkit User's Guide (v. 1.0.5)". Matplotlib Basemap Toolkit documentation. Retrieved 24 April 2013.
- Elson, Philip. "Cartopy". Retrieved 24 April 2013.
- Schlömer, Nico. "matplotlib2tikz". Retrieved 7 November 2016.
- "Bigglessimple, elegant python plotting". biggles.sourceforge.net. Retrieved 24 November 2010.
- "Chaco". code.enthought.com.
- "Gnuplot.py on". gnuplot-py.sourceforge.net. Retrieved 24 November 2010.
- "PyCha". bitbucket.org.
- "PyPlotter - graph plotting". www.eckhartarnold.de. Retrieved 2020-03-14.
- "Bokeh 2.0.0 Documentation". docs.bokeh.org. Retrieved 2020-03-14.
