Nevada's 4th congressional district
Nevada's 4th congressional district is a congressional district that was created as a result of the 2010 United States Census.[4] Located in the central portion of the state, it includes most of northern Clark County, southern Lyon County and all of Esmeralda, Lincoln, Mineral, Nye and White Pine counties.
| Nevada's 4th congressional district | |||
|---|---|---|---|
.tif.png.webp) Nevada's 4th congressional district since January 3, 2013 | |||
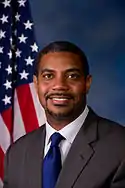
| Representative |
| ||
| Population (2019) | 773,641 | ||
| Median household income | $62,241[1] | ||
| Ethnicity | |||
| Cook PVI | D+3[3] | ||
Although the district appears rural, over 80% of its population lives in the heavily Democratic northern portion of Clark County. As a result, the district leans Democratic at the federal level.
The district has flipped between Democratic and Republican representation since it was created. Democrat Steven Horsford won the election for this seat in the 2012 House elections. He was seated for the 113th U.S. Congress in 2013 as the district's first congressman, serving just one term before he was defeated by Republican Cresent Hardy in November 2014. In turn, Hardy lost to Democrat Ruben Kihuen in 2016. Kihuen did not run for reelection in 2018, and the seat was won by Horsford in a rematch against Hardy.
Presidential voting
Election results from presidential races:[5]
| Year | Office | Result |
|---|---|---|
| 2012 | President | Obama 54% – Romney 44% |
| 2016 | President | Clinton 50% – Trump 45% |
| 2020 | President | Biden 51% – Trump 47% |
List of members representing the district
| Member (District Home) |
Party | Years | Cong ress |
Electoral history | |
|---|---|---|---|---|---|
| District created January 3, 2013 | |||||
 Steven Horsford (Las Vegas) |
Democratic | January 3, 2013 – January 3, 2015 |
113th | Elected in 2012. Lost re-election. | |
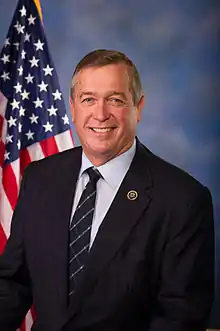 Cresent Hardy (Mesquite) |
Republican | January 3, 2015 – January 3, 2017 |
114th | Elected in 2014. Lost re-election. | |
 Ruben Kihuen (Las Vegas) |
Democratic | January 3, 2017 – January 3, 2019 |
115th | Elected in 2016. Retired.[6] | |
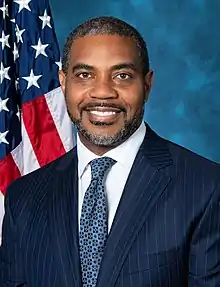 Steven Horsford (Las Vegas) |
Democratic | January 3, 2019 – Present |
116th 117th |
Elected in 2018. Re-elected in 2020. | |
Election results
2012
| Party | Candidate | Votes | % | ||
|---|---|---|---|---|---|
| Democratic | Steven Horsford | 120,501 | 50.11 | ||
| Republican | Danny Tarkanian | 101,261 | 42.11 | ||
| Independent American | Floyd Fitzgibbons | 9,389 | 3.90 | ||
| Libertarian | Michael Haines | 9,341 | 3.88 | ||
| Total votes | 240,492 | 100.0 | |||
| Democratic win (new seat) | |||||
2014
| Party | Candidate | Votes | % | |||
|---|---|---|---|---|---|---|
| Republican | Cresent Hardy | 63,466 | 48.53 | |||
| Democratic | Steven Horsford (Incumbent) | 59,844 | 45.76 | |||
| Libertarian | Steve Brown | 4,119 | 3.15 | |||
| Independent American | Russell Best | 3,352 | 2.56 | |||
| Total votes | 130,781 | 100.0 | ||||
| Republican gain from Democratic | ||||||
2016
| Party | Candidate | Votes | % | |||
|---|---|---|---|---|---|---|
| Democratic | Ruben Kihuen | 128,985 | 48.52 | |||
| Republican | Cresent Hardy (Incumbent) | 118,328 | 44.51 | |||
| Libertarian | Steve Brown | 10,206 | 3.84 | |||
| Independent American | Mike Little | 8,327 | 3.13 | |||
| Total votes | 265,846 | 100.0 | ||||
| Democratic gain from Republican | ||||||
2018
| Party | Candidate | Votes | % | ±% | |
|---|---|---|---|---|---|
| Democratic | Steven Horsford | 121,936 | 51.93 | +3.41% | |
| Republican | Cresent Hardy | 102,740 | 43.75 | -0.76% | |
| Independent American | Warren Markowitz | 3,180 | 1.35 | -1.78% | |
| Independent | Rodney Smith | 2,731 | 1.16 | N/A | |
| Libertarian | Greg Luckner | 2,213 | 0.94 | -2.90% | |
| Independent | Dean McGonigle | 2,031 | 0.86 | N/A | |
| Margin of victory | 19,196 | 8.18 | +4.17% | ||
| Total votes | 234,831 | 100.0 | N/A | ||
| Democratic hold | |||||
2020
| Party | Candidate | Votes | % | |
|---|---|---|---|---|
| Democratic | Steven Horsford (incumbent) | 168,457 | 50.7 | |
| Republican | Jim Marchant | 152,284 | 45.8 | |
| Libertarian | Jonathan Royce Esteban | 7,978 | 2.4 | |
| Independent American | Barry Rubinson | 3,750 | 1.1 | |
| Total votes | 332,469 | 100.0 | ||
| Democratic hold | ||||
References
- Center for New Media & Promotion (CNMP), US Census Bureau. "My Congressional District". www.census.gov. Retrieved September 9, 2020.
- Center for New Media & Promotion (CNMP), US Census Bureau. "My Congressional District". www.census.gov. Retrieved September 9, 2020.
- "Partisan Voting Index – Districts of the 115th Congress" (PDF). The Cook Political Report. April 7, 2017. Retrieved April 7, 2017.
- "Census 2010 shows Red states gaining congressional districts". Washington Post. Retrieved December 21, 2010.
- Presidential Election Results, by district, swingstateproject.com
- Viebeck, Elise (December 16, 2017). "Rep. Ruben Kihuen won't seek re-election amid sexual harassment allegations". Washington Post. Washington DC. Retrieved December 16, 2017.
- "Silver State Election Night Results – 2012". Nevada Secretary of State. Retrieved August 20, 2017.
- "Silver State Election Night Results – 2014". Nevada Secretary of State. Retrieved August 20, 2017.
- "Silver State Election Night Results – 2016". Nevada Secretary of State. Retrieved August 20, 2017.
- "Silver State 2018 Election Night Results | U.S. House of Representatives". Nevada Secretary of State. November 14, 2018.
- "Silver State 2020 Election Results - U.S. Congress". Nevada Secretary of State. Retrieved November 27, 2020.