On-base percentage
In baseball statistics, on-base percentage (OBP), also known as on-base average/OBA, measures how frequently a batter reaches base.[1] It is the ratio of the batter's times-on-base (TOB) (the sum of hits, walks, and times hit by pitch) to their number of plate appearances.[1] OBP does not credit the batter for reaching base due to fielding error, fielder's choice, dropped/uncaught third strike, fielder's obstruction, or catcher's interference.

An official MLB statistic since 1984, it is sometimes referred to as on-base average/OBA, as it is rarely presented as a true percentage.
On-base percentage is added to slugging average to determine on-base plus slugging (OPS). The on-base percentage of all batters faced by one pitcher or team is referred to as on-base against.
History
On-base percentage is calculable for professional teams dating back to the first year of National Association of Professional Base Ball Players competition in 1871,[2] due to the component values of its formula being recorded in box scores of the time. However, the statistic was not conceptualized until sometime in the late 1940s by Brooklyn Dodgers team statistician Allan Roth, in consultation with then-Dodgers general manager Branch Rickey.[3][4] In 1954, Rickey, who was then the general manager of the Pittsburgh Pirates, was featured in a Life Magazine graphic in which the formula for on-base percentage was shown as the first component of an all-encompassing "offense" equation.[5] However, it was not named as on-base percentage, and there is little evidence that Roth's statistic was taken seriously at the time by the baseball community at large.[6]
On-base percentage became an official MLB statistic in 1984. Since then, especially since the publication of the influential 2003 book Moneyball which prominently highlighted Oakland Athletics general manager Billy Beane's focus on the statistic, on-base percentage has seen its perceived importance as a measure of offensive success increase dramatically.[7] Many baseball observers, particularly those influenced by the field of sabermetrics, now consider on-base percentage to be superior to the traditional statistic meant to measure offensive skill, batting average.[8][9] This is most notably because while both statistics incorporate a batter's success in recording hits, batting average ignores, while on-base percentage incorporates, the rate at which a batter is also able to avoid making an out and reach base via bases on balls or "walks."[10]
Overview
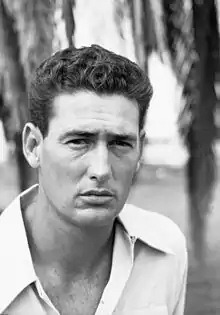
Traditionally, players with the best on-base percentages bat as leadoff hitter, unless they are power hitters, who traditionally bat slightly lower in the batting order. The league average for on-base percentage in Major League Baseball has varied considerably over time; at its peak in the late 1990s, it was around .340, whereas it was typically .300 during the dead-ball era. On-base percentage can also vary quite considerably from player to player. The highest career OBP of a batter with more than 3,000 plate appearances is .482 by Ted Williams. The lowest is by Bill Bergen, who had an OBP of .194.
On-base percentage is calculated using this formula:[11][12][13]
where
- H = Hits
- BB = Bases on Balls (Walks)
- HBP = Hit By Pitch
- AB = At bat
- SF = Sacrifice fly
In certain unofficial calculations, the denominator is simplified and replaced by Plate Appearance (PA); however, the calculation PAs includes certain infrequent events that will slightly lower the calculated OBP (i.e. catcher's interference, and sacrifice bunts).[13] Sacrifice bunts are excluded from consideration on the basis that they are usually imposed by the manager with the expectation that the batter will not reach base, and thus do not accurately reflect the batter's ability to reach base when attempting to do so.[1]
All-time leaders
bold is active player
Single-season leaders
| # | Player | OBP[15] | Team | Year |
| 1 | Barry Bonds | .6094 | San Francisco Giants | 2004 |
| 2 | Barry Bonds | .5817 | San Francisco Giants | 2002 |
| 3 | Ted Williams | .5528 | Boston Red Sox | 1941 |
| 4 | John McGraw | .5475 | Baltimore Orioles | 1899 |
| 5 | Babe Ruth | .5445 | New York Yankees | 1923 |
| 6 | Babe Ruth | .5319 | New York Yankees | 1920 |
| 7 | Barry Bonds | .5291 | San Francisco Giants | 2003 |
| 8 | Ted Williams | .5256 | Boston Red Sox | 1957 |
| 9 | Billy Hamilton | .5209 | Philadelphia Phillies | 1894 |
| 10 | Babe Ruth | .5156 | New York Yankees | 1926 |
See also
Notes
- "Glossary / Standard Stats / On-base Percentage (OBP)". MLB.com. Retrieved 13 June 2018.
- "Yearly League Leaders & Records for On-Base%". Baseball-Reference.com. Retrieved 2020-07-01.
- "What is a On-base Percentage (OBP)? | Glossary". Major League Baseball. Retrieved 2020-07-01.
- admin. "Allan Roth – Society for American Baseball Research". Retrieved 2020-07-01.
- Rickey, Branch (August 2, 1954). "Goodby to Some Old Baseball Ideas". Life. Retrieved July 1, 2020.
- Schwarz, Alan (2004). The Numbers Game: Baseball's Lifelong Fascination with Statistics. New York: St. Martin's Press. p. 55. ISBN 9780312322229.
- "Prospectus Idol Entry: Why is On Base Percentage King?". Baseball Prospectus. 2009-05-23. Retrieved 2020-07-01.
- "My plea to mainstream on-base percentage instead of batting average". CBSSports.com. Retrieved 2020-07-01.
- "Stat to the Future: Why it's time to stop relying on batting average". www.sportingnews.com. Retrieved 2020-07-01.
- "OBP | Sabermetrics Library". Retrieved 2020-07-01.
- [https://www.baseball-reference.com/leaders/onbase_perc_career.shtml Baseball reference: OBP
- Beyond the Box Score
- Fangraphs
- "Career Leaders for On Base Percentage". Sports Reference, Inc. Retrieved 2011-06-25.
- "Single Season League Leaders for On-Base Percentage". Sports Reference, Inc. Retrieved 2011-06-25.