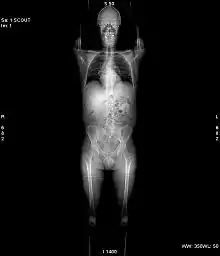
Operation of computed tomography
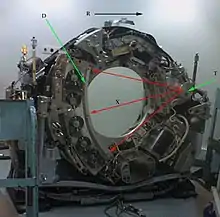
X-ray computed tomography operates by using an X-ray generator that rotates around the object; X-ray detectors are positioned on the opposite side of the circle from the X-ray source.


T: X-ray tube
D: X-ray detectors
X: X-ray beam
R: Gantry rotation
A visual representation of the raw data obtained is called a sinogram, yet it is not sufficient for interpretation. Once the scan data has been acquired, the data must be processed using a form of tomographic reconstruction, which produces a series of cross-sectional images. In terms of mathematics, the raw data acquired by the scanner consists of multiple "projections" of the object being scanned. These projections are effectively the Radon transformation of the structure of the object. Reconstruction essentially involves solving the inverse Radon transformation.
Structure
In conventional CT machines, an X-ray tube and detector are physically rotated behind a circular shroud (see the image above right). An alternative, short lived design, known as electron beam tomography (EBT), used electromagnetic deflection of an electron beam within a very large conical X-ray tube and a stationary array of detectors to achieve very high temporal resolution, for imaging of rapidly moving structures, for example the coronary arteries. Systems with a very large number of detector rows, such that the z-axis coverage is comparable to the xy-axis coverage are often termed cone beam CT, due to the shape of the X-ray beam (strictly, the beam is pyramidal in shape, rather than conical). Cone-beam CT is commonly found in medical fluoroscopy equipment; by rotating the fluoroscope around the patient, a geometry similar to CT can be obtained, and by treating the 2D X-ray detector in a manner similar to a CT detector with a massive number of rows, it is possible to reconstruct a 3D volume from a single rotation using suitable software.
Contrast media
Contrast mediums used for X-ray CT, as well as for plain film X-ray, are called radiocontrasts. Radiocontrasts for X-ray CT are, in general, iodine-based.[2] This is useful to highlight structures such as blood vessels that otherwise would be difficult to delineate from their surroundings. Using contrast material can also help to obtain functional information about tissues. Often, images are taken both with and without radiocontrast.
Schematic configuration and motion
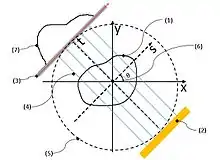
In this section, the schematic configuration and motion of the parallel beam irradiation optical system configured to obtain the p(s,θ) of above-mentioned (eq. 5) will be explained. In this section, how to obtain the p(s,θ) of (eq.5) by utilizing parallel beam irradiation optical system will also be explained. Configuration and motions of parallel beam irradiation optical system, referring the Fig. 3.
Statements
Numbers (1)–(7) shown in the Fig. 3 (see the numbers within the parentheses) respectively indicate: (1) = an object; (2) = the parallel beam light source; (3) = the screen; (4) = transmission beam; (5) = the datum circle (a datum feature); (6) = the origin (a datum feature); and (7) = a fluoroscopic image (a one-dimensional image; p (s, θ)).
Two datum coordinate systems xy and ts are imagined in order to explain the positional relations and movements of features (0)–(7) in the figure. The xy and ts coordinate systems share the origin (6) and they are positioned on the same plane. That is, the xy plane and the ts plane are the same plane. Henceforth, this virtual plane will be called “the datum plane”. In addition, a virtual circle centered at the abovementioned origin (6) is set on the datum plane (it will be called “the datum circle” henceforth). This datum circle (6) will be represents the orbit of the parallel beam irradiation optical system. Naturally, the origin (6), the datum circle (5), and the datum coordinate systems are virtual features which are imagined for mathematical purposes.
The μ(x,y) is absorption coefficient of the object (3) at each (x,y), p(s,θ) (7) is the collection of fluoroscopic images.
Motion of parallel beam irradiation optical system
The parallel beam irradiation optical system is the key component of a CT scanner. It consists of a parallel beam X-ray source (2) and the screen (3). They are positioned so that they face each other in parallel with the origin (6) in between, both being in contact with the datum circle (6).
These two features ((2) and (3)) can rotate counterclockwise [Notes 1] around the origin (6) together with the ts coordinate system while maintaining the relative positional relations between themselves and with the ts coordinate system (so, these two features ((2) and (3)) are always opposed each other). The ts plane is positioned so that the direction from a collimated X-ray source (2) to the screen (3) matches the positive direction of the t-axis while the s-axis parallels these two features. Henceforth, the angle between the x- and the s-axes will be indicated as θ. That is, parallel beam irradiation optical system where the angle between the object and the transmission beam equals θ. This datum circle (6) will be represents the orbit of the parallel beam irradiation optical system.
On the other hand, the object (1) will be scanned by CT scanner is fixed to xy coordination system. Hence, object (1) will not be moved while the parallel beam irradiation optical system are rotated around the object (1). The object (1) must be smaller than datum circle.
Increment/Table speed
The distance the table moves for every 360° rotation of the X-ray generator is called the increment or table feed for axial scan modes. For helical scan modes, it is called table speed.[3] Setting an increment that is smaller than the slice thickness results in overlap between the slices. A beneficial effect of this is a smoother transition between images when scrolling through the stack.[4]
Obtaining transmission image ‘s’
During the above-mentioned motion (that is pivoting around the object(1)) of parallel beam irradiation optical system, the collimated X-ray source (2) emits transmission beam (4) which are effectively “parallel rays” in a geometrical optical sense. The traveling direction of each ray of the transmission beam (4) is parallel to the t-axis. The transmission beam (4), emitted by the X-ray source (2), penetrates the object and reaches the screen (3) after attenuation due to absorption by the object.
Optical transmission can be presumed to occur ideally. That is, transmission beam penetrates without diffraction, diffusion, or reflection although it is absorbed by the object and its attenuation is assumed to occur in accordance with the Beer-Lambert law.
Consequently, a fluoroscopic image (7) is recorded on the screen as a one-dimensional image (one image is recorded for every θ corresponding to all s values). When the angle between the object and transmission beam is θ and if the intensity of transmission beam (4) having reached each "s" point on the screen is expressed as p(s, θ), it expresses a fluoroscopic image (7) corresponding to each θ.
Tomographic reconstruction
The technique of filtered back projection is one of the most established algorithmic techniques for this problem. It is conceptually simple, tunable and deterministic. It is also computationally undemanding, with modern scanners requiring only a few milliseconds per image. However, this is not the only technique available: the original EMI scanner solved the tomographic reconstruction problem by linear algebra, but this approach was limited by its high computational complexity, especially given the computer technology available at the time. More recently, manufacturers have developed iterative physical model-based maximum likelihood expectation maximization techniques. These techniques are advantageous because they use an internal model of the scanner's physical properties and of the physical laws of X-ray interactions. Earlier methods, such as filtered back projection, assume a perfect scanner and highly simplified physics, which leads to a number of artifacts, high noise and impaired image resolution. Iterative techniques provide images with improved resolution, reduced noise and fewer artifacts, as well as the ability to greatly reduce the radiation dose in certain circumstances.[5] The disadvantage is a very high computational requirement, but advances in computer technology and high-performance computing techniques, such as use of highly parallel GPU algorithms or use of specialized hardware such as FPGAs or ASICs, now allow practical use.
Basic principle
In this section, the basic principle of tomography in the case that especially uses tomography utilizing the parallel beam irradiation optical system will be explained.
Tomography is a technology that uses a tomographic optical system to obtain virtual 'slices' (a tomographic image) of specific cross section of a scanned object, allowing the user to see inside the object without cutting. There are several types of tomographic optical system including the parallel beam irradiation optical system. Parallel beam irradiation optical system may be the easiest and most practical example of a tomographic optical system therefore, in this article, explanation of "How to obtain the Tomographic image" will be based on "the parallel beam irradiation optical system". The resolution in tomography is typically described by the Crowther criterion.

The Fig. 3 is intended to illustrate the mathematical model and to illustrate the principle of tomography. In the Fig.3, absorption coefficient at a cross-sectional coordinate (x, y) of the subject is modeled as μ(x, y). Consideration based on the above assumptions may clarify the following items. Therefore, in this section, the explanation is advanced according to the order as follows:
- (1)Results of measurement, i.e. a series of images obtained by transmitted light are expressed (modeled) as a function p (s,θ) obtained by performing radon transform to μ(x, y), and
- (2)μ(x, y) is restored by performing inverse radon transform to measurement results.
(1)The Results of measurement p(s,θ) of parallel beam irradiation optical system
Considers the mathematical model such that the absorption coefficient of the object at each (x,y) are represented by μ(x,y) and one supposes that "the transmission beam penetrates without diffraction, diffusion, or reflection although it is absorbed by the object and its attenuation is assumed to occur in accordance with the Beer-Lambert law. In this matter, what we want to know” is μ(x,y) and what we can measure will be following p(s,θ).
When the attenuation is conformed to Beer-Lambert law, the relation between and is as following (eq.1) and therefore, the absorbance () along the light beam path (l(t)) is as following (eq.2). Here the is intensity of light beam before transmission is intensity of after transmission.
- (eq. 1)
- (eq. 2)
Here, a direction from the light source toward the screen is defined as t direction and that perpendicular to t direction and parallel with the screen is defined as s direction. (Both t-s and x-y coordinate systems are set up such that they are reflected each other without mirror-reflective transformation.)
By using a parallel beam irradiation optical system, one can experimentally obtain the series of fluoroscopic images (a one-dimensional images” pθ(s) of specific cross section of a scanned object) for each θ. Here, θ represents angle between the object and the transmission light beam. In the Fig.3, X-Y plane rotates counter clockwise [Notes 1] around the point of origin in the plane in such a way “to keep mutual positional relationship between the light source (2) and screen (7) passing through the trajectory (5).” Rotation angle of this case is same as above-mentioned θ.
The beam having an angle θ,to will be the collection of lays, represented by of following (eq. 3).
- (eq. 3)
The pθ(s) is defined by following (eq. 4). That is equal to the line integral of μ(x,y) along of (eq. 3) as the same manner of (eq.2). That means that, of following (eq. 5) is a resultant of Radon transformation of μ(x,y).
- (eq. 4)
One can define following function of two variables (eq. 5). In this article, following p(s, θ) is called to be "the collection of fluoroscopic images".
- p (s, θ)=pθ(s) (eq. 5)
(2)μ(x, y) is restored by performing inverse radon transform to measurement results
“What we want to know (μ(x,y))” can be reconstructed from “What we measured ( p(s,θ))” by using inverse radon transformation . In the above-mentioned descriptions, “What we measured” is p(s,θ) . On the other hand, “What we want to know ” is μ(x,y). So, the next will be "How to reconstruct μ(x,y) from p(s,θ)".
Spiral CT
| Spiral computed tomography | |
|---|---|
| MeSH | D036542 |
Spiral computed tomography, or helical computed tomography, is a computed tomography (CT) technology in which the source and detector travel along a helical path relative to the object. Typical implementations involve moving the patient couch through the bore of the scanner whilst the gantry rotates. Spiral CT can achieve improved image resolution for a given radiation dose, compared to individual slice acquisition. Most modern hospitals currently use spiral CT scanners.
Willi Kalender is credited with invention of the technique, and uses the term spiral CT.[6] Kalender argues that the terms spiral and helical are synonymous and equally acceptable.[7]
There are a class of image artifacts specific to helical acquisition.[8]
Single-slice and multi-slice Spiral CT
Since its invention by Kalender in the 1980s, helical scan CT machines have steadily increased the number of rows of detectors (slices) they deploy. The prototype 16 multi-slice scanner was introduced in 2001 and in 2004, 64 multislice scanners are on the market. These can produce an image in less than a second and thus can obtain images of the heart and its blood vessels (coronary vessels) as if frozen in time.
In order to illuminate multiple rows of detector elements in a multi-slice scanner, the x-ray source must emit a beam which is divergent along the axial direction (i.e. a cone beam instead of a fan beam).
Pitch

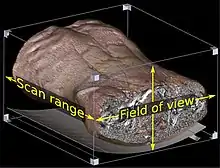
A helical CT beam trajectory is characterized by its pitch, which is equal to the table feed distance along the scan range over one gantry rotation divided by the section collimation.[9] When pitch is greater than 1, the radiation dose for a given axial field of view (FOV) is decreased compared to conventional CT. At high pitches there is, however, a trade-off in terms of noise and longitudinal resolution.[10]
Helical (or spiral) cone beam computed tomography
In cone-beam computed tomography (commonly abbreviated CBCT), the X-ray beam is conical.[11]
Helical (or spiral) cone beam computed tomography is a type of three-dimensional computed tomography (CT) in which the source (usually of X-rays) describes a helical trajectory relative to the object while a two-dimensional array of detectors measures the transmitted radiation on part of a cone of rays emanating from the source.
In practical helical cone beam X-ray CT machines, the source and array of detectors are mounted on a rotating gantry while the patient is moved axially at a uniform rate. Earlier X-ray CT scanners imaged one slice at a time by rotating source and one-dimensional array of detectors while the patient remained static. The helical scan method reduces the X-ray dose to the patient required for a given resolution while scanning more quickly. This is, however, at the cost of greater mathematical complexity in the reconstruction of the image from the measurements.
History
The earliest sensors were scintillation detectors, with photomultiplier tubes excited by (typically) cesium iodide crystals. Cesium iodide was replaced during the 1980s by ion chambers containing high-pressure xenon gas. These systems were in turn replaced by scintillation systems based on photodiodes instead of photomultipliers and modern scintillation materials (for example rare-earth garnet or rare-earth oxide ceramics) with more desirable characteristics.
Initial machines would rotate the X-ray source and detectors around a stationary object. Following a complete rotation, the object would be moved along its axis, and the next rotation started. Newer machines permitted continuous rotation with the object to be imaged slowly and smoothly slid through the X-ray ring. These are called helical or spiral CT machines. A subsequent development of helical CT was multi-slice (or multi-detector) CT; instead of a single row of detectors, multiple rows of detectors are used effectively capturing multiple cross-sections simultaneously.
References
- Jun, Kyungtaek; Yoon, Seokhwan (2017). "Alignment Solution for CT Image Reconstruction using Fixed Point and Virtual Rotation Axis". Scientific Reports. 7: 41218. arXiv:1605.04833. Bibcode:2017NatSR...741218J. doi:10.1038/srep41218. ISSN 2045-2322. PMC 5264594. PMID 28120881.
- Webb, W. Richard; Brant, Wiliam E.; Major, Nancy M. (2014). Fundamentals of Body CT. Elsevier Health Sciences. p. 152. ISBN 9780323263580.
- "CT scan parameters: Translation of terms for different manufacturers" (PDF). IAEA. American Association of Physicists in Medicine. 2011-08-11.
- Page 310 in: Kristen M. Waterstram-Rich; David Gilmore (2016). Nuclear Medicine and PET/CT: Technology and Techniques (8 ed.). Elsevier Health Sciences. ISBN 9780323400350.
- Barkan, O; Weill, J; Averbuch, A; Dekel, S. "Adaptive Compressed Tomography Sensing". In Proceedings of the IEEE Conference on Computer Vision and Pattern Recognition 2013 (pp. 2195–2202).
- Kalender WA (1994). "Technical foundations of spiral CT" Semin Ultrasound CT MR 15: (2) 81-89.
- Kalender WA (1994). "Spiral or helical CT: right or wrong?" Radiology Archived 2010-10-11 at the Wayback Machine 193: (2) 583.
- Barrett and Keat (2004) RadioGraphics 24:1679-1691 https://dx.doi.org/10.1148/rg.246045065
- Heiken et. al. (1993) Radiology 189:647-656 https://dx.doi.org/10.1148/radiology.189.3.8234684
- Maldjian and Goldman (2013) AJR 200:741-747 https://dx.doi.org/10.2214/AJR.12.9768
- Helical+Cone-Beam+CT at the US National Library of Medicine Medical Subject Headings (MeSH)
Notes
- In this article, the following discussion is developed based on anticlockwise motion. But, whether the direction of the rotation is anti-clockwise or a clockwise is not an essential problem. Even if the rotational direction is assumed to be in an opposite direction, no specific impact is caused on essential level except for some minor deformation of formula including reversing a part of positive or negative signs.