Results breakdown of the 1983 Spanish local elections (Cantabria)
This is the results breakdown of the local elections held in Cantabria on 8 May 1983. The following tables show detailed results in the autonomous community's most populous municipalities, sorted alphabetically.[1][2]
City control
The following table lists party control in the most populous municipalities, including provincial capitals (shown in bold).[1] Gains for a party are displayed with the cell's background shaded in that party's colour.
| Municipality | Population | Previous control | New control | ||
|---|---|---|---|---|---|
| Santander | 179,694 | Union of the Democratic Centre (UCD) | People's Coalition (AP–PDP–UL) | ||
| Torrelavega | 56,490 | Spanish Socialist Workers' Party (PSOE) | Spanish Socialist Workers' Party (PSOE) | ||
Municipalities
Santander
- Population: 179,694
 | ||||||
| Parties and coalitions | Popular vote | Seats | ||||
|---|---|---|---|---|---|---|
| Votes | % | ±pp | Total | +/− | ||
| People's Coalition (AP–PDP–UL)1 | 52,994 | 57.35 | +45.40 | 17 | +14 | |
| Spanish Socialist Workers' Party (PSOE) | 30,390 | 32.89 | +9.42 | 10 | +3 | |
| Communist Party of Spain (PCE) | 3,504 | 3.79 | –4.87 | 0 | –2 | |
| Regionalist Party of Cantabria (PRC) | 2,113 | 2.29 | –11.64 | 0 | –4 | |
| Democratic and Social Centre (CDS) | 1,077 | 1.17 | New | 0 | ±0 | |
| Independents (INDEP) | 822 | 0.89 | New | 0 | ±0 | |
| Independents (INDEP) | 785 | 0.85 | New | 0 | ±0 | |
| Cantabrian Liberal Democratic Party (PDLC) | 412 | 0.45 | New | 0 | ±0 | |
| Ecologist Movement of Spain (MEE) | 301 | 0.33 | New | 0 | ±0 | |
| Union of the Democratic Centre (UCD) | n/a | n/a | –33.78 | 0 | –10 | |
| Party of Labour of Cantabria (PTC) | n/a | n/a | –6.00 | 0 | –1 | |
| Blank ballots | 0 | 0.00 | ±0.00 | |||
| Total | 92,398 | 27 | ±0 | |||
| Valid votes | 92,398 | 100.00 | +1.17 | |||
| Invalid votes | 0 | 0.00 | –1.17 | |||
| Votes cast / turnout | 92,398 | 68.78 | +9.61 | |||
| Abstentions | 41,943 | 31.22 | –9.61 | |||
| Registered voters | 134,341 | |||||
| Sources[1][3] | ||||||
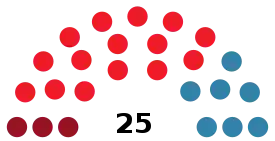
Torrelavega
- Population: 56,490
 | ||||||
| Parties and coalitions | Popular vote | Seats | ||||
|---|---|---|---|---|---|---|
| Votes | % | ±pp | Total | +/− | ||
| Spanish Socialist Workers' Party (PSOE) | 13,646 | 46.30 | +17.59 | 15 | +8 | |
| People's Coalition (AP–PDP–UL)1 | 7,142 | 24.23 | +15.16 | 7 | +5 | |
| Communist Party of Spain (PCE) | 2,807 | 9.52 | –0.13 | 3 | +1 | |
| Independents (INDEP) | 1,469 | 4.98 | New | 0 | ±0 | |
| Democratic and Social Centre (CDS) | 1,033 | 3.50 | New | 0 | ±0 | |
| Independents (INDEP) | 813 | 2.76 | New | 0 | ±0 | |
| Regionalist Party of Cantabria (PRC) | 662 | 2.25 | –5.22 | 0 | –2 | |
| Independents (INDEP) | 643 | 2.18 | New | 0 | ±0 | |
| Cantabrian Liberal Democratic Party (PDLC) | 627 | 2.13 | New | 0 | ±0 | |
| Independents (INDEP) | 482 | 1.64 | New | 0 | ±0 | |
| Ecologist Movement of Spain (MEE) | 150 | 0.51 | New | 0 | ±0 | |
| Union of the Democratic Centre (UCD) | n/a | n/a | –19.10 | 0 | –5 | |
| Independent Popular Candidacy (CPI) | n/a | n/a | –18.38 | 0 | –5 | |
| Workers' Revolutionary Organization (ORT) | n/a | n/a | –7.63 | 0 | –2 | |
| Blank ballots | 0 | 0.00 | ±0.00 | |||
| Total | 29,474 | 25 | ±0 | |||
| Valid votes | 29,474 | 100.00 | +1.01 | |||
| Invalid votes | 0 | 0.00 | –1.01 | |||
| Votes cast / turnout | 29,474 | 73.15 | +8.86 | |||
| Abstentions | 10,819 | 26.85 | –8.86 | |||
| Registered voters | 40,293 | |||||
| Sources[1][4] | ||||||
References
- "Elecciones Municipales en Asturias y Cantabria (1979 - 2019)". Historia Electoral.com (in Spanish). Retrieved 3 July 2020.
- "Elecciones Municipales. 8 de mayo de 1983. Cantabria". eldiario.es (in Spanish). Retrieved 3 July 2020.
- "Electoral Results Consultation. Municipal. May 1983. Santander Municipality". Ministry of the Interior (in Spanish). Retrieved 3 July 2020.
- "Electoral Results Consultation. Municipal. May 1983. Torrelavega Municipality". Ministry of the Interior (in Spanish). Retrieved 3 July 2020.
This article is issued from Wikipedia. The text is licensed under Creative Commons - Attribution - Sharealike. Additional terms may apply for the media files.