Results of the 1984 Australian federal election (Senate)
The following tables show state-by-state results in the Australian Senate at the 1984 federal election. Senators total 29 coalition (27 Liberal, one coalition National, one CLP), 34 Labor, one Nuclear Disarmament Party, four non-coalition National, seven Democrats, and one Independent.[1] Senator terms are six years (three for territories), and all took their seats immediately due to the expansion of the senate from 64 to 76 members.
| |||||||||||||||||||||||||||||||||||||||||||||
46 of the 76 seats in the Australian Senate 39 seats needed for a majority | |||||||||||||||||||||||||||||||||||||||||||||
|---|---|---|---|---|---|---|---|---|---|---|---|---|---|---|---|---|---|---|---|---|---|---|---|---|---|---|---|---|---|---|---|---|---|---|---|---|---|---|---|---|---|---|---|---|---|
| |||||||||||||||||||||||||||||||||||||||||||||
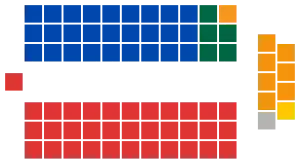 Senators elected in the 1984 federal election | |||||||||||||||||||||||||||||||||||||||||||||
| |||||||||||||||||||||||||||||||||||||||||||||


As the previous election was a double dissolution, half of the senators elected at that election had their terms backdated to 1 July 1982, to end on 30 June 1988. Senator terms for those contesting this election would have been for 6 year intervals starting from 1 July 1985, but the Double dissolution election of 1987 removed this necessity.
Australia
| Party | Votes | % | Swing | Seats won | Total seats | Change | ||
|---|---|---|---|---|---|---|---|---|
| Australian Labor Party | 3,750,789 | 42.17 | −3.32 | 20 | 34 | +4 | ||
| Liberal–National coalition | 3,516,857 | 39.54 | −0.41 | 20 | 33 | +5 | ||
| Liberal/National joint ticket | 1,130,601 | 12.71 | −11.49 | 3 | * | * | ||
| Liberal Party of Australia | 1,831,006 | 20.59 | +8.58 | 14 | 27 | +4 | ||
| National Party of Australia | 527,278 | 5.93 | +0.87 | 2 | 5 | +1 | ||
| Country Liberal Party | 27,972 | 0.31 | +0.04 | 1 | 1 | 0 | ||
| Australian Democrats | 677,970 | 7.62 | −2.32 | 5 | 7 | +2 | ||
| Nuclear Disarmament Party | 643,061 | 7.23 | * | 1 | 1 | +1 | ||
| Call to Australia Party | 162,272 | 1.82 | −0.04 | 0 | 0 | 0 | ||
| Harradine Group | 22,992 | 0.26 | −0.32 | 0 | 1 | 0 | ||
| Other | 120,159 | 1.35 | −1.37 | 0 | 0 | 0 | ||
| Total | 8,894,100 | 46 | 76 | +12 | ||||
New South Wales
| Elected | # | Senator | Party | |
|---|---|---|---|---|
| 1985 | ||||
| 1985 | 1 | Kerry Sibraa | Labor | |
| 1985 | 2 | Chris Puplick | Liberal | |
| 1985 | 3 | Bruce Childs | Labor | |
| 1985 | 4 | David Brownhill | National | |
| 1985 | 5 | John Morris | Labor | |
| 1985 | 6 | Michael Baume | Liberal | |
| 1985 | 7 | Colin Mason | Democrats | |
| 1982 | ||||
| 1982 | 1 | Arthur Gietzelt | Labor | |
| 1982 | 2 | John Carrick | Liberal | |
| 1982 | 3 | Graham Richardson | Labor | |
| 1982 | 4 | Peter Baume | Liberal | |
| 1982 | 5 | Doug McClelland | Labor | |
| Party | Candidate | Votes | % | ±% | |
|---|---|---|---|---|---|
| Quota | 381,462 | ||||
| Labor | 1. Kerry Sibraa (elected 1) 2. Bruce Childs (elected 3) 3. John Morris (elected 5) 4. Sue West |
1,268,489 | 41.6 | -5.7 | |
| Coalition | 1. Chris Puplick (Lib) (elected 2) 2. David Brownhill (Nat) (elected 4) 3. Michael Baume (Lib) (elected 6) 4. Bronwyn Bishop (Lib) 5. Doug Moppett (Nat) |
1,130,601 | 37.0 | -1.1 | |
| Nuclear Disarmament | 1. Peter Garrett 2. Gillian Fisher 3. Marie-Anne Hockings 4. Russel Ward |
294,772 | 9.7 | +9.7 | |
| Democrats | 1. Colin Mason (elected 7) 2. Paul McLean 3. Jenny MacLeod 4. Garry Chestnut |
223,095 | 7.3 | -1.3 | |
| Call to Australia | 1. Graham McLennan 2. Tom Toogood 3. Patricia Judge 4. Kevin Hume 5. John Everingham 6. Clair Isbister 7. Elaine Nile |
109,046 | 3.6 | +0.2 | |
| Group F | 1. Bill Wentworth 2. Robert Clark 3. Raymond King 4. Myfanwy Young |
17,530 | 0.6 | +0.6 | |
| Group H | 1. Burnum Burnum 2. Rocky Thomas |
4,331 | 0.1 | +0.1 | |
| Independent | Helen Hibbard | 1,671 | 0.1 | +0.1 | |
| Group D | 1. Henry Soper 2. Maureen Nathan 3. Peter Wright 4. Archibald Brown 5. William More 6. John Veenstra |
966 | 0.0 | 0.0 | |
| Independent | Helen Richards | 634 | 0.0 | 0.0 | |
| Group G | 1. Peter Consandine 2. Brian Buckley |
557 | 0.0 | 0.0 | |
| Total formal votes | 3,051,692 | 94.4 | +5.5 | ||
| Informal votes | 181,272 | 5.6 | -5.5 | ||
| Turnout | 3,232,964 | 94.4 | -0.5 | ||
Victoria
| Elected | # | Senator | Party | |
|---|---|---|---|---|
| 1985 | ||||
| 1985 | 1 | Olive Zakharov | Labor | |
| 1985 | 2 | Alan Missen | Liberal | |
| 1985 | 3 | Robert Ray | Labor | |
| 1985 | 4 | David Hamer | Liberal | |
| 1985 | 5 | Barney Cooney | Labor | |
| 1985 | 6 | Jim Short | Liberal | |
| 1985 | 7 | John Siddons | Democrats | |
| 1982 | ||||
| 1982 | 1 | John Button | Labor | |
| 1982 | 2 | Margaret Guilfoyle | Liberal | |
| 1982 | 3 | Gareth Evans | Labor | |
| 1982 | 4 | Austin Lewis | Liberal | |
| 1982 | 5 | Don Chipp | Democrats | |
| Party | Candidate | Votes | % | ±% | |
|---|---|---|---|---|---|
| Quota | 298,787 | ||||
| Labor | 1. Olive Zakharov (elected 1) 2. Robert Ray (elected 3) 3. Barney Cooney (elected 5) 4. Carole Marple |
1,053,488 | 44.0 | -2.4 | |
| Liberal | 1. Alan Missen (elected 2) 2. David Hamer (elected 4) 3. Jim Short (elected 6) 4. Richard Alston 5. Zirka Yaskewych |
816,362 | 34.2 | +34.2 | |
| Nuclear Disarmament | 1. Jean Melzer 2. Venturino Venturini |
174,389 | 7.3 | +7.3 | |
| Democrats | 1. John Siddons (elected 7) 2. Janet Powell 3. Ian Price 4. Sid Spindler 5. Kenneth Peak |
165,624 | 6.9 | -5.1 | |
| National | 1. Shirley McKerrow 2. John Cromarty 3. Louise Jenkins 4. John Keating 5. Murray Buzza |
95,954 | 4.0 | +4.0 | |
| Democratic Labour | 1. Brian Handley 2. Maria Handley 3. William Mahony 4. Lois Mahony |
32,472 | 1.3 | -0.9 | |
| Call to Australia | 1. Barry Tattersall 2. Valerie Renkema 3. Edna Hall 4. John Easton |
30,797 | 1.3 | +1.3 | |
| Pensioner | 1. Neil McKay 2. Margaret Carter |
19,922 | 0.8 | +0.8 | |
| Independent | Maurice Smith | 615 | 0.0 | 0.0 | |
| Independent | Tiger Casley | 249 | 0.0 | 0.0 | |
| Independent | Bill Kapphan | 168 | 0.0 | 0.0 | |
| Independent | Michael Krape | 155 | 0.0 | 0.0 | |
| Independent | Augustus Titter | 93 | 0.0 | 0.0 | |
| Total formal votes | 2,390,288 | 95.8 | +6.5 | ||
| Informal votes | 104,906 | 4.2 | -6.5 | ||
| Turnout | 2,495,194 | 95.4 | -0.5 | ||
- The Liberals and Nationals contested the previous election as a Coalition in the previous election, and did not do so in this election. The Coalition vote of 1983 of 38.2% was unchanged from the combined Liberal and National vote of this election.
Queensland
| Elected | # | Senator | Party | |
|---|---|---|---|---|
| 1985 | ||||
| 1985 | 1 | Margaret Reynolds | Labor | |
| 1985 | 2 | Ron Boswell | National | |
| 1985 | 3 | David MacGibbon | Liberal | |
| 1985 | 4 | Gerry Jones | Labor | |
| 1985 | 5 | Glen Sheil | National | |
| 1985 | 6 | John Black | Labor | |
| 1985 | 7 | Michael Macklin | Democrats | |
| 1982 | ||||
| 1982 | 1 | George Georges | Labor | |
| 1982 | 2 | Flo Bjelke-Petersen | National | |
| 1982 | 3 | Warwick Parer | Liberal | |
| 1982 | 4 | Mal Colston | Labor | |
| 1982 | 5 | Stan Collard | National | |
| Party | Candidate | Votes | % | ±% | |
|---|---|---|---|---|---|
| Quota | 176,095 | ||||
| Labor | 1. Margaret Reynolds (elected 1) 2. Gerry Jones (elected 4) 3. John Black (elected 6) 4. Bryant Burns |
558,623 | 39.7 | +0.1 | |
| National | 1. Ron Boswell (elected 2) 2. Glen Sheil (elected 5) 3. Patrick Behan 4. Alan Metcalfe |
406,829 | 28.9 | -0.2 | |
| Liberal | 1. David MacGibbon (elected 3) 2. William Everingham 3. Olive-Orme Scott-Young 4. Christopher Gilbert 5. Maurice Thomson |
244,753 | 17.4 | +2.5 | |
| Democrats | 1. Michael Macklin (elected 7) 2. Ray Hollis 3. John Elfick 4. Cheryl Kernot |
129,636 | 9.2 | +1.3 | |
| Nuclear Disarmament | 1. Patsy Goodwin 2. Bernard Hockings |
62,102 | 4.4 | +4.4 | |
| Conservative | 1. Fast Bucks 2. Peter Livesey |
4,731 | 0.3 | +0.3 | |
| Group B | 1. Hugh Bruce 2. Michael Carr |
1,317 | 0.1 | +0.1 | |
| Independent | Frank Bologna | 335 | 0.0 | 0.0 | |
| Independent | Raymond Medwin | 207 | 0.0 | 0.0 | |
| Independent | Norman Eather | 94 | 0.0 | 0.0 | |
| Independent | Cyril McKenzie | 86 | 0.0 | 0.0 | |
| Independent | Dietar Soegemeier | 39 | 0.0 | 0.0 | |
| Total formal votes | 1,408,752 | 97.0 | +5.6 | ||
| Informal votes | 43,919 | 3.0 | -5.6 | ||
| Turnout | 1,452,671 | 93.4 | +0.8 | ||
Western Australia
| Elected | # | Senator | Party | |
|---|---|---|---|---|
| 1985 | ||||
| 1985 | 1 | Patricia Giles | Labor | |
| 1985 | 2 | Noel Crichton-Browne | Liberal | |
| 1985 | 3 | Peter Cook | Labor | |
| 1985 | 4 | Reg Withers | Liberal | |
| 1985 | 5 | Jim McKiernan | Labor | |
| 1985 | 6 | Sue Knowles | Liberal | |
| 1985 | 7 | Jo Vallentine | NDP | |
| 1982 | ||||
| 1982 | 1 | Peter Walsh | Labor | |
| 1982 | 2 | Fred Chaney | Liberal | |
| 1982 | 3 | Ruth Coleman | Labor | |
| 1982 | 4 | Peter Durack | Liberal | |
| 1982 | 5 | Gordon McIntosh | Labor | |
| Party | Candidate | Votes | % | ±% | |
|---|---|---|---|---|---|
| Quota | 96,467 | ||||
| Labor | 1. Patricia Giles (elected 1) 2. Peter Cook (elected 3) 3. Jim McKiernan (elected 5) 4. John Crouch |
334,371 | 43.3 | -6.0 | |
| Liberal | 1. Noel Crichton-Browne (elected 2) 2. Reg Withers (elected 4) 3. Sue Knowles (elected 6) 4. Murray Nixon |
313,738 | 40.7 | -0.3 | |
| Nuclear Disarmament | 1. Jo Vallentine (elected 7) 2. Lindsay Matthews |
52,365 | 6.8 | +6.8 | |
| Democrats | 1. Jack Evans 2. Richard Jeffreys 3. Jean Jenkins |
37,369 | 4.8 | -2.0 | |
| Australian Family Movement | 1. Brian Peachey 2. Beryl Van Lyn 3. Nellie Clark 4. John Gilmour 5. Kenneth Wright 6. Roland Bott |
18,041 | 2.3 | +2.3 | |
| National | 1. Bruce Currie 2. Eric Blight 3. Mort Schell 4. Graham Barrett-Lennard |
13,739 | 1.7 | +0.6 | |
| Group E | 1. Frank Nesci 2. Nellie Stuart |
1,033 | 0.1 | +0.1 | |
| Independent | Peter van Tongeren | 861 | 0.1 | +0.1 | |
| Independent | Frank Ash | 154 | 0.0 | 0.0 | |
| Independent | Martin Suter | 62 | 0.0 | 0.0 | |
| Total formal votes | 771,733 | 95.3 | +3.1 | ||
| Informal votes | 37,739 | 4.7 | -3.1 | ||
| Turnout | 809,472 | 94.2 | +1.2 | ||
South Australia
| Elected | # | Senator | Party | |
|---|---|---|---|---|
| 1985 | ||||
| 1985 | 1 | Nick Bolkus | Labor | |
| 1985 | 2 | Baden Teague | Liberal | |
| 1985 | 3 | Graham Maguire | Labor | |
| 1985 | 4 | Don Jessop | Liberal | |
| 1985 | 5 | Rosemary Crowley | Labor | |
| 1985 | 6 | Amanda Vanstone | Liberal | |
| 1985 | 7 | David Vigor | Democrats | |
| 1982 | ||||
| 1982 | 1 | Ron Elstob | Labor | |
| 1982 | 2 | Tony Messner | Liberal | |
| 1982 | 3 | Janine Haines | Democrats | |
| 1982 | 4 | Dominic Foreman | Labor | |
| 1982 | 5 | Robert Hill | Liberal | |
| Party | Candidate | Votes | % | ±% | |
|---|---|---|---|---|---|
| Quota | 101,997 | ||||
| Labor | 1. Nick Bolkus (elected 1) 2. Graham Maguire (elected 3) 3. Rosemary Crowley (elected 5) 4. Vic Heron |
340,115 | 41.7 | -2.9 | |
| Liberal | 1. Baden Teague (elected 2) 2. Don Jessop (elected 4) 3. Amanda Vanstone (elected 6) 4. Robert Giles |
306,027 | 37.5 | -2.9 | |
| Democrats | 1. David Vigor (elected 7) 2. John Coulter 3. Mike Elliott 4. Sandra Kanck |
91,329 | 11.2 | -0.9 | |
| Nuclear Disarmament | 1. Frances Mowling 2. Ian Modistach 3. Douglas Peers |
37,834 | 4.6 | +4.6 | |
| Call to Australia | 1. Bob Brown 2. Dean Davis 3. William Pomery |
22,429 | 2.7 | +2.7 | |
| National | 1. John Bannon 2. Judith Jackson 3. Ray Rothe 4. Helen Scott 5. Audrey Pobke |
10,756 | 1.3 | -0.4 | |
| Pensioner | 1. Wilfred Scott 2. Kenneth Perry |
4,052 | 0.5 | +0.5 | |
| Group F | 1. Judy Gillett 2. Brian Sones 3. Eugene Sibelle |
1,328 | 0.2 | +0.2 | |
| Group D | 1. Joe Rossi 2. Warwick Stallard 3. Giovanni Melino 4. Gizella Farkas |
840 | 0.1 | +0.1 | |
| Australian Family Movement | 1. Bob Boyd 2. Fred Tanner |
800 | 0.1 | +0.1 | |
| Independent | Herman Bersee | 199 | 0.0 | 0.0 | |
| Independent | Peter Gagliardi | 169 | 0.0 | 0.0 | |
| Independent | Edward Dyer | 92 | 0.0 | 0.0 | |
| Total formal votes | 815,970 | 94.6 | +3.4 | ||
| Informal votes | 46,399 | 5.4 | -3.4 | ||
| Turnout | 862,369 | 95.2 | +0.2 | ||
Tasmania
| Elected | # | Senator | Party | |
|---|---|---|---|---|
| 1985 | ||||
| 1985 | 1 | Terry Aulich | Labor | |
| 1985 | 2 | Brian Archer | Liberal | |
| 1985 | 3 | Ray Devlin | Labor | |
| 1985 | 4 | John Watson | Liberal | |
| 1985 | 5 | John Coates | Labor | |
| 1985 | 6 | Michael Townley | Liberal | |
| 1985 | 7 | Norm Sanders | Democrats | |
| 1982 | ||||
| 1982 | 1 | Peter Rae | Liberal | |
| 1982 | 2 | Don Grimes | Labor | |
| 1982 | 3 | Brian Harradine | Independent | |
| 1982 | 4 | Shirley Walters | Liberal | |
| 1982 | 5 | Michael Tate | Labor | |
| Party | Candidate | Votes | % | ±% | |
|---|---|---|---|---|---|
| Quota | 32,724 | ||||
| Labor | 1. Terry Aulich (elected 1) 2. Ray Devlin (elected 3) 3. John Coates (elected 5) 4. John White |
108,900 | 41.6 | +8.8 | |
| Liberal | 1. Brian Archer (elected 2) 2. John Watson (elected 4) 3. Michael Townley (elected 6) 4. Eric Abetz 5. Des Cooper 6. Michael Chabrel |
106,427 | 40.6 | -2.0 | |
| Group C | 1. Kath Venn 2. Colin Sacco |
22,992 | 8.8 | -9.0 | |
| Democrats | 1. Norm Sanders (elected 7} 2. Lyn Hewitt |
15,897 | 6.1 | -0.7 | |
| Nuclear Disarmament | 1. Ian Paulin 2. Anne Parker |
7,574 | 2.9 | +2.9 | |
| Total formal votes | 261,790 | 94.2 | +1.6 | ||
| Informal votes | 16,155 | 5.8 | -1.6 | ||
| Turnout | 277,945 | 95.8 | -0.2 | ||
Australian Capital Territory
| Elected | # | Senator | Party | |
|---|---|---|---|---|
| 1984 | ||||
| 1984 | 1 | Susan Ryan | Labor | |
| 1984 | 2 | Margaret Reid | Liberal | |
| Party | Candidate | Votes | % | ±% | |
|---|---|---|---|---|---|
| Quota | 45,608 | ||||
| Labor | 1. Susan Ryan (elected 1) 2. Hugh Saddler |
60,735 | 44.4 | -10.9 | |
| Liberal | 1. Margaret Reid (elected 2) 2. David Walters |
43,685 | 31.9 | +0.2 | |
| Nuclear Disarmament | 1. John Conway 2. Jan Barratt |
14,025 | 10.3 | +10.3 | |
| Democrats | 1. John Hatton 2. Julia Knyvett |
12,569 | 9.2 | -2.7 | |
| Referendum First | 1. Allan Nelson 2. Tony Spagnolo |
5,807 | 4.2 | +4.2 | |
| Total formal votes | 136,821 | 96.6 | -0.1 | ||
| Informal votes | 4,352 | 3.4 | +0.1 | ||
| Turnout | 141,173 | 93.9 | -1.8 | ||
Northern Territory
| Elected | # | Senator | Party | |
|---|---|---|---|---|
| 1984 | ||||
| 1984 | 1 | Bernie Kilgariff | CLP | |
| 1984 | 2 | Ted Robertson | Labor | |
| Party | Candidate | Votes | % | ±% | |
|---|---|---|---|---|---|
| Quota | 19,004 | ||||
| Country Liberal | 1. Bernie Kilgariff (elected 1) 2. Patricia Davies |
27,972 | 48.9 | +0.8 | |
| Labor | 1. Ted Robertson (elected 2) 2. Warren Snowdon |
26,040 | 45.4 | -0.6 | |
| Democrats | 1. Betty Pearce 2. Fay Lawrence |
2,449 | 4.2 | -1.1 | |
| Independent | Vincent Forrester | 548 | 0.9 | +0.9 | |
| Total formal votes | 57,009 | 96.8 | +1.5 | ||
| Informal votes | 1,862 | 3.2 | -1.5 | ||
| Turnout | 58,871 | 85.5 | +4.1 | ||
See also
References
- "Federal Election Results 1949-1993" (PDF). Parliament of Australia. Retrieved 12 July 2017.