1984 Australian federal election
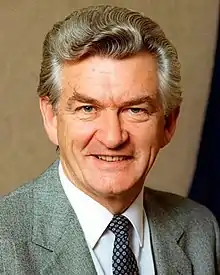
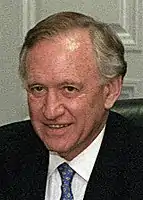
The 1984 Australian federal election was held in Australia on 1 December 1984. All 148 seats in the House of Representatives (24 of them newly created) and 46 of 76 seats in the Senate (12 of them newly created) were up for election. The incumbent Labor Party led by Prime Minister Bob Hawke defeated the opposition Liberal–National coalition, led by Andrew Peacock.
| |||||||||||||||||||||||||||||||
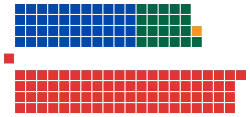
All 148 seats in the House of Representatives 75 seats were needed for a majority in the House 46 (of the 76) seats in the Senate | |||||||||||||||||||||||||||||||
|---|---|---|---|---|---|---|---|---|---|---|---|---|---|---|---|---|---|---|---|---|---|---|---|---|---|---|---|---|---|---|---|
| |||||||||||||||||||||||||||||||
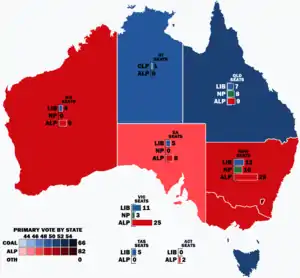 Popular vote by state and territory with graphs indicating the number of seats won. As this is an IRV election, seat totals are not determined by popular vote by state or territory but instead via results in each electorate. | |||||||||||||||||||||||||||||||
| |||||||||||||||||||||||||||||||
The election was held in conjunction with two referendum questions, neither of which were carried.
Background and issues
The election had a long campaign and a high rate of informal voting for the House of Representatives, but decreased rate in the Senate (due to the introduction of the Group voting ticket). The election was held 18 months ahead of time, partly to bring the elections for the House of Representatives and Senate back into line following the double dissolution election of 1983.
The legislated increase in the size of the House of Representatives by 24 seats and the Senate by 12 seats came into effect at the 1984 election. Prior to 1984 the electoral commission did not undertake a full distribution of preferences for statistical purposes. The stored ballot papers for the previous election were put through this process prior to their destruction – therefore the figures from 1983 onwards show the actual result based on full distribution of preferences.
Results
House of Representatives
| Party | Votes | % | Swing | Seats | Change | ||
|---|---|---|---|---|---|---|---|
| Labor | 4,120,130 | 47.55 | −1.93 | 82 | +7 | ||
| Liberal–National coalition | 3,900,042 | 45.01 | –1.40 | 66 | +16 | ||
| Liberal | 2,951,556 | 34.06 | −0.06 | 45 | +12 | ||
| National | 921,151 | 10.63 | +1.42 | 21 | +4 | ||
| Country Liberal | 27,335 | 0.32 | +0.08 | 0 | 0 | ||
| Democrats | 472,204 | 5.45 | +0.42 | 0 | 0 | ||
| Democratic Labor | 49,121 | 0.57 | +0.37 | 0 | 0 | ||
| Nuclear Disarmament | 17,978 | 0.21 | +0.21 | 0 | 0 | ||
| Socialist Workers | 9,460 | 0.11 | –0.42 | 0 | 0 | ||
| Deadly Serious | 2,826 | 0.03 | –0.01 | 0 | 0 | ||
| Pensioner | 1,645 | 0.02 | +0.02 | 0 | 0 | ||
| Communist | 1,213 | 0.01 | –0.06 | 0 | 0 | ||
| Independent | 90,333 | 1.04 | +0.07 | 0 | 0 | ||
| Total | 8,664,952 | 148 | +23 | ||||
| Two-party-preferred | |||||||
| Australian Labor Party | WIN | 51.77 | −1.46 | 82 | +7 | ||
| Liberal–National coalition | 48.23 | +1.46 | 66 | +16 | |||
Senate

Labor (34)
Opposition (33)
Coalition
Liberal (27)
National (5)
CLP (1)
Crossbench (9)
Democrats (7)
NDP (1)
Independent (1)
| Party | Votes | % | Swing | Seats Won | Total Seats | Change | ||
|---|---|---|---|---|---|---|---|---|
| Labor | 3,750,789 | 42.17 | −3.32 | 20 | 34 | +4 | ||
| Liberal–National coalition | 3,516,857 | 39.54 | –0.41 | 20 | 33 | +5 | ||
| Liberal | 1,831,006 | 20.59 | +8.58 | 14 | 27 | +4 | ||
| Liberal–National joint ticket | 1,130,601 | 12.71 | −11.49 | 3 | N/A | N/A | ||
| National | 527,278 | 5.93 | +0.87 | 2 | 5 | +1 | ||
| Country Liberal | 27,972 | 0.31 | +0.04 | 1 | 1 | 0 | ||
| Democrats | 677,970 | 7.62 | −2.32 | 5 | 7 | +2 | ||
| Nuclear Disarmament | 643,061 | 7.23 | +7.23 | 1 | 1 | +1 | ||
| Call to Australia | 162,272 | 1.82 | −0.04 | 0 | 0 | 0 | ||
| Democratic Labor | 32,472 | 0.37 | +0.37 | 0 | 0 | 0 | ||
| Pensioner | 23,974 | 0.27 | +0.27 | 0 | 0 | 0 | ||
| Family Movement | 18,841 | 0.21 | +0.21 | 0 | 0 | 0 | ||
| Referendum First | 5,807 | 0.07 | +0.07 | 0 | 0 | 0 | ||
| Conservative | 4,731 | 0.05 | +0.05 | 0 | 0 | 0 | ||
| Independent | 57,326 | 0.64 | +0.64 | 0 | 1 | 0 | ||
| Total | 8,894,100 | 46 | 76 | +12 | ||||
Seats changing hands
| Seat | Pre-1984 | Swing | Post-1984 | ||||||
|---|---|---|---|---|---|---|---|---|---|
| Party | Member | Margin | Margin | Member | Party | ||||
| Farrer, NSW | Liberal | Wal Fife | N/A | N/A | 13.0 | Tim Fischer | National | ||
| Flinders, Vic | Labor | Bob Chynoweth | 1.0 | 1.5 | 1.2 | Peter Reith | Liberal | ||
| Forde, Qld | Labor | notional – new seat | 2.7 | 2.7 | 0.0 | David Watson | Liberal | ||
| Gilmore, NSW | Labor | notional – new seat | 0.5 | 1.7 | 1.2 | John Sharp | National | ||
| Hinkler, Qld | Labor | notional – new seat | 0.6 | 0.8 | 0.2 | Bryan Conquest | National | ||
| Hume, NSW | National | Stephen Lusher | N/A | N/A | 7.7 | Wal Fife | Liberal | ||
| Macquarie, NSW | Labor | Ross Free | 0.5 | 1.9 | 1.4 | Alasdair Webster | Liberal | ||
| Northern Territory, NT | Labor | John Reeves | 1.9 | 3.3 | 1.4 | Paul Everingham | Country Liberal | ||
| Petrie, Qld | Labor | Dean Wells | 0.5 | 2.1 | 0.6 | John Hodges | Liberal | ||
| Riverina-Darling, NSW | Labor | notional – new seat | 1.3 | 5.9 | 4.6 | Noel Hicks | National | ||
- Members in italics did not contest their seat at this election.
Analysis
The results of the election surprised most analysts; the expectation had been that Bob Hawke – who had been polling a record ACNielsen approval rating of 75 percent[1] on the eve of the election – would win by a significantly larger margin. Labor instead suffered a 2-point swing against it and had its majority cut from 25 to 16. Hawke blamed the result on the changes to Senate vote cards, which he believed confused people regarding their House of Representatives votes and contributed to the relatively high informal vote, the majority of which apparently was Labor votes.[2] Andrew Peacock did well from a good performance in the one leaders' debate, held on 26 November 1984.[3] This was the first televised leaders' debate in Australia.[4]
See also
Notes
- "The biggest hammering in history". The Sydney Morning Herald. 20 May 2008. Retrieved 20 May 2008.
- Hawke, RJL (1996). The Hawke Memoirs. Port Melbourne: Mandarin. pp. 275–276. "Attracted to the simplicity of the Senate ballot, a number of voters thought they could mark their Lower House ballot in exactly the same way. Unfortunately for both them and us the informal vote for the House of Representatives swelled from 2 per cent to nearly 7 per cent. On the best surmise the bulk of the informals were Labor votes."
- Fraser, Bryce (1998). The Macquarie Reference Series: Government in Australia. Sydney: The Macquarie Library Pty Ltd. p. 44. ISBN 1-876429-02-X.
- "1984 Federal Election". AustralianPolitics.com. Retrieved 30 July 2016.
References
- University of WA election results in Australia since 1890
- AEC 2PP vote
- AustralianPolitics.com election details
| Federal elections | |
|---|---|
| Referendums | |
| |