Results of the 1996 Australian federal election (Senate)
The following tables show state-by-state results in the Australian Senate at the 1996 federal election. Senators total 35 coalition (31 Liberal, three coalition National, one CLP), 29 Labor, two Green, two non-coalition National, seven Democrats, and one Independent.[1] Senator terms are six years (three for territories), and took their seats from 1 July 1996, except the territories who took their seats immediately.
| |||||||||||||||||||||||||||||||||||||||||||||
40 of the 76 seats in the Australian Senate 39 seats needed for a majority | |||||||||||||||||||||||||||||||||||||||||||||
|---|---|---|---|---|---|---|---|---|---|---|---|---|---|---|---|---|---|---|---|---|---|---|---|---|---|---|---|---|---|---|---|---|---|---|---|---|---|---|---|---|---|---|---|---|---|
| |||||||||||||||||||||||||||||||||||||||||||||
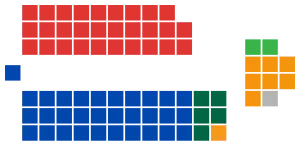 Senators elected in the 1996 federal election | |||||||||||||||||||||||||||||||||||||||||||||
| |||||||||||||||||||||||||||||||||||||||||||||
.jpg.webp)

Australia
| Party | Votes | % | Swing | Seats Won | Seats Held | ||
|---|---|---|---|---|---|---|---|
| Liberal–National coalition | 4,792,682 | 43.97 | +0.92 | 20 | 37 | ||
| Liberal–National joint ticket | 2,669,377 | 24.49 | +0.09 | 6 | N/A | ||
| Liberal | 1,770,486 | 16.24 | +0.65 | 12 | 31 | ||
| National | 312,769 | 2.87 | +0.15 | 1 | 5 | ||
| Country Liberal | 40,050 | 0.37 | +0.04 | 1 | 1 | ||
| Labor | 3,940,150 | 36.15 | −7.35 | 14 | 29 | ||
| Democrats | 1,179,357 | 10.82 | +5.51 | 5 | 7 | ||
| Greens[lower-alpha 1] | 345,513 | 3.17 | +0.67 | 1 | 2 | ||
| Against Further Immigration | 137,604 | 1.26 | +0.82 | 0 | 0 | ||
| Call to Australia | 117,274 | 1.08 | +0.25 | 0 | 0 | ||
| Shooters | 114,724 | 1.05 | +0.45 | 0 | 0 | ||
| Women's | 49,131 | 0.45 | +0.45 | 0 | 0 | ||
| Reclaim Australia | 44,545 | 0.41 | +0.41 | 0 | 0 | ||
| Democratic Labor | 36,156 | 0.33 | −0.03 | 0 | 0 | ||
| Better Future | 18,960 | 0.17 | +0.17 | 0 | 0 | ||
| Natural Law | 17,082 | 0.16 | −0.20 | 0 | 0 | ||
| No Aircraft Noise | 17,043 | 0.16 | −0.20 | 0 | 0 | ||
| Grey Power | 13,401 | 0.12 | −0.04 | 0 | 0 | ||
| Pensioner & CIR Alliance | 9,040 | 0.08 | −0.13 | 0 | 0 | ||
| Seniors | 8,268 | 0.08 | +0.08 | 0 | 0 | ||
| Republican | 7,778 | 0.07 | −0.06 | 0 | 0 | ||
| One Australia | 3,638 | 0.03 | +0.03 | 0 | 0 | ||
| Indigenous Peoples | 2,772 | 0.03 | −0.03 | 0 | 0 | ||
| Independent EFF | 2,430 | 0.02 | +0.02 | 0 | 0 | ||
| Independents | 41,489 | 0.38 | −1.99 | 0 | 1 | ||
| Total | 10,899,037 | 40 | 76 | ||||
- Notes
- Includes votes for the federal Australian Greens (261,677) as well as Greens Western Australia (57,006) and the Tasmanian Greens (26,830), which had not yet aligned with the federal party
New South Wales
| Elected | # | Senator | Party | |
| 1996 | ||||
| 1996 | 1 | Bob Woods | Liberal | |
| 1996 | 2 | Sue West | Labor | |
| 1996 | 3 | David Brownhill | National | |
| 1996 | 4 | Bruce Childs | Labor | |
| 1996 | 5 | Helen Coonan | Liberal | |
| 1996 | 6 | Vicki Bourne | Democrats | |
| 1993 | ||||
| 1993 | 1 | Michael Forshaw | Labor | |
| 1993 | 2 | Michael Baume | Liberal | |
| 1993 | 3 | John Faulkner | Labor | |
| 1993 | 4 | John Tierney | Liberal | |
| 1993 | 5 | Belinda Neal | Labor | |
| 1993 | 6 | Sandy Macdonald | National | |
| Party | Candidate | Votes | % | ±% | |
|---|---|---|---|---|---|
| Quota | 526,041 | ||||
| Coalition | 1. Bob Woods (Lib) (elected 1) 2. David Brownhill (Nat) (elected 3) 3. Helen Coonan (Lib) (elected 5) 4. Abraham Constantin (Lib) |
1,522,722 | 41.3 | +2.4 | |
| Labor | 1. Sue West (elected 2) 2. Bruce Childs (elected 4) 3. Tom Wheelwright 4. Rima Barghout |
1,370,918 | 37.2 | -9.2 | |
| Democrats | 1. Vicki Bourne (elected 6) 2. Arthur Chesterfield-Evans 3. Andrew Larcos 4. Troy Anderson |
351,491 | 9.5 | +4.6 | |
| Greens | 1. Karla Sperling 2. Peter Denton 3. Jane Elix 4. Murray Matson |
85,004 | 2.3 | +0.2 | |
| Shooters | 1. Richard Sims 2. Robyn Bourke 3. Daniel Redfern 4. Rodney Franich |
74,032 | 2.0 | +0.2 | |
| Call to Australia | 1. Alasdair Webster 2. Elaine Webster 3. Graeme McLennan 4. Bill Bird 5. Bruce Coleman |
72,969 | 2.0 | +0.5 | |
| AAFI | 1. John Phillips 2. Bevan O'Regan |
61,811 | 1.7 | +1.0 | |
| Reclaim Australia | 1. David Kitson 2. Carolyn O'Callaghan |
44,545 | 1.2 | +1.2 | |
| ABFFOC | 1. Teresa Findlay-Barnes 2. David Tribe |
18,960 | 0.5 | +0.5 | |
| Women's Party | 1. Darelle Duncan 2. Sarah Thew |
17,417 | 0.5 | +0.5 | |
| No Aircraft Noise | 1. Chris Nash 2. Sylvia Hale |
17,043 | 0.5 | +0.5 | |
| Seniors | 1. Beryl Evans 2. Lorraine Welsh |
8,268 | 0.2 | +0.2 | |
| Grey Power | 1. John Verheyen 2. Theo Hetterscheid 3. Bob Segerstrom 4. Olga Pickering |
5,173 | 0.1 | +0.1 | |
| Independent | Jade Hurley | 4,765 | 0.1 | +0.1 | |
| Natural Law | 1. Catherine Knoles 2. Ines Judd |
3,702 | 0.1 | -0.2 | |
| Group I | 1. Robert Schollbach 2. Amanda Stirling |
3,632 | 0.1 | +0.1 | |
| Republican | 1. Peter Breen 2. Kerry McNally 3. Valerie Housego 4. Assefa Bekele 5. Antoinette Fahey |
2,846 | 0.1 | +0.1 | |
| Group K | 1. Tony Galati 2. Sam Galati |
1,128 | 0.0 | 0.0 | |
| Group M | 1. Robert Butler 2. Lindsay Cosgrove |
657 | 0.0 | 0.0 | |
| Independent | Morris Jones | 485 | 0.0 | 0.0 | |
| Independent | Dian Underwood | 433 | 0.0 | 0.0 | |
| Independent | Bill Bradley | 383 | 0.0 | 0.0 | |
| Independent | Gretel Pinniger | 382 | 0.0 | 0.0 | |
| Independent | Ray Patterson | 295 | 0.0 | 0.0 | |
| Independent | Ivor F | 210 | 0.0 | 0.0 | |
| Independent | John Barbara | 57 | 0.0 | 0.0 | |
| Independent | David Piggin | 31 | 0.0 | 0.0 | |
| Total formal votes | 3,682,283 | 96.2 | -1.1 | ||
| Informal votes | 143,388 | 3.8 | +1.1 | ||
| Turnout | 3,825,671 | 96.7 | +0.2 | ||
Victoria
| Elected | # | Senator | Party | |
| 1996 | ||||
| 1996 | 1 | Richard Alston | Liberal | |
| 1996 | 2 | Robert Ray | Labor | |
| 1996 | 3 | Rod Kemp | Liberal | |
| 1996 | 4 | Barney Cooney | Labor | |
| 1996 | 5 | Kay Patterson | Liberal | |
| 1996 | 6 | Lyn Allison | Democrats | |
| 1993 | ||||
| 1993 | 1 | Stephen Conroy | Labor | |
| 1993 | 2 | Jim Short | Liberal | |
| 1993 | 3 | Kim Carr | Labor | |
| 1993 | 4 | Julian McGauran | National | |
| 1993 | 5 | Jacinta Collins | Labor | |
| 1993 | 6 | Judith Troeth | Liberal | |
| Party | Candidate | Votes | % | ±% | |
|---|---|---|---|---|---|
| Quota | 395,356 | ||||
| Coalition | 1. Richard Alston (Lib) (elected 1) 2. Rod Kemp (Lib) (elected 3) 3. Kay Patterson (Lib) (elected 5) 4. Robert Ettery (Nat) 5. Robyne Head (Lib) 6. Anthony Fernandez (Lib) |
1,146,655 | 41.4 | -2.7 | |
| Labor | 1. Robert Ray (elected 2) 2. Barney Cooney (elected 4) 3. Julia Gillard 4. Melanie Raymond |
1,100,799 | 39.8 | -5.2 | |
| Democrats | 1. Lyn Allison (elected 6) 2. John McLaren 3. Laurie Levy 4. Marj White |
300,848 | 10.9 | +6.9 | |
| Greens | 1. Peter Singer 2. Karen Alexander 3. Helen Lucas |
81,273 | 2.9 | +1.7 | |
| AAFI | 1. Dennis McCormack 2. Robyn Spencer |
40,607 | 1.4 | +1.4 | |
| Democratic Labour | 1. John Mulholland 2. Paul Cahill 3. Michael Rowe 4. Pat Crea 5. Matthew Cody 6. Christine Dodd |
36,156 | 1.3 | -0.1 | |
| Shooters | 1. Colin Wood 2. Neville Sayers 3. Gary Fliegner |
19,573 | 0.7 | +0.7 | |
| Call to Australia | 1. Ken Cook 2. Christine Chapman |
16,497 | 0.6 | -0.1 | |
| Pensioner and CIR | 1. Will Borzatti 2. Neil McKay |
9,040 | 0.3 | -0.5 | |
| Natural Law | 1. Stephen Griffith 2. Ngaire Mason |
6,681 | 0.2 | -0.2 | |
| Independent | David Armstrong | 3,321 | 0.1 | +0.1 | |
| Republican | 1. Paul Dahan 2. Des Bergen |
2,249 | 0.1 | -0.1 | |
| Group J | 1. Joe Toscano 2. Steve Roper |
2,038 | 0.1 | +0.1 | |
| Independent | Stephen Raskovy | 619 | 0.0 | 0.0 | |
| Independent | Maurice Smith | 150 | 0.0 | 0.0 | |
| Independent | Michael Good | 110 | 0.0 | 0.0 | |
| Independent | John Abbotto | 96 | 0.0 | 0.0 | |
| Independent | Neil Green | 75 | 0.0 | 0.0 | |
| Total formal votes | 2,767,485 | 96.4 | -0.5 | ||
| Informal votes | 101,789 | 3.6 | +0.5 | ||
| Turnout | 2,869,274 | 96.5 | -0.1 | ||
Queensland
| Elected | # | Senator | Party | |
| 1996 | ||||
| 1996 | 1 | Ian Macdonald | Liberal | |
| 1996 | 2 | John Hogg | Labor | |
| 1996 | 3 | Ron Boswell | National | |
| 1996 | 4 | John Herron | Liberal | |
| 1996 | 5 | Brenda Gibbs | Labor | |
| 1996 | 6 | Cheryl Kernot | Democrats | |
| 1993 | ||||
| 1993 | 1 | Margaret Reynolds | Labor | |
| 1993 | 2 | David MacGibbon | Liberal | |
| 1993 | 3 | Bill O'Chee | National | |
| 1993 | 4 | Mal Colston | Labor | |
| 1993 | 5 | John Herron | Liberal | |
| 1993 | 6 | John Woodley | Democrats | |
| Party | Candidate | Votes | % | ±% | |
|---|---|---|---|---|---|
| Quota | 274,924 | ||||
| Liberal | 1. Ian Macdonald (elected 1) 2. John Herron (elected 4) 3. Debbie Kember |
680,553 | 35.4 | +3.9 | |
| Labor | 1. John Hogg (elected 2) 2. Brenda Gibbs (elected 5) 3. Bernadette Callaghan |
583,850 | 30.3 | -9.1 | |
| National | 1. Ron Boswell (elected 3) 2. Teresa Cobb 3. Terry Cranwell |
288,199 | 15.0 | +0.5 | |
| Democrats | 1. Cheryl Kernot (elected 6) 2. Tony Walters 3. Peter Collins 4. Annette Reed |
254,219 | 13.2 | +6.2 | |
| Greens | 1. Angela Jones 2. Desiree Mahoney 3. Libby Connors |
46,285 | 2.4 | -0.8 | |
| AAFI | 1. Cynthia Mayne 2. John Minogue |
13,117 | 0.7 | +0.7 | |
| Women's Party | 1. Mary Kelly 2. Lizbeth Yuille 3. Jenny Hughey |
13,006 | 0.7 | +0.7 | |
| Shooters | 1. Peter Salisbury 2. Bill Ison |
12,146 | 0.6 | +0.6 | |
| Call to Australia | 1. Harry Cook 2. Nan Cook |
9,543 | 0.5 | -0.1 | |
| Group G | 1. J Freemarijuana 2. Tony Kneipp |
3,836 | 0.2 | +0.2 | |
| Natural Law | 1. Kris Ayyar 2. John Price |
3,656 | 0.2 | 0.0 | |
| One Australia | 1. Perry Jewell 2. Michael Grayson |
3,638 | 0.2 | +0.2 | |
| Group F | 1. Phillip Young 2. Harvie Ladlow |
2,793 | 0.1 | +0.1 | |
| Indigenous Peoples | 1. Sam Watson 2. Netta Tyson |
2,772 | 0.1 | +0.1 | |
| Republican | 1. Brian Buckley 2. David Bailey |
2,683 | 0.1 | +0.1 | |
| Group H | 1. Ian McNiven 2. Ray Smyth 3. Robert Marks |
1,909 | 0.1 | +0.1 | |
| Group M | 1. Maurice Hetherington 2. Ross Russell |
738 | 0.0 | 0.0 | |
| Group E | 1. John Jones 2. Lee Jones |
613 | 0.0 | 0.0 | |
| Independent | Michelle Mac Nevin | 594 | 0.0 | 0.0 | |
| Independent | Ross McKay | 154 | 0.0 | 0.0 | |
| Independent | David Howse | 91 | 0.0 | 0.0 | |
| Independent | Chris Leth | 67 | 0.0 | 0.0 | |
| Total formal votes | 1,924,462 | 96.7 | -1.3 | ||
| Informal votes | 64,979 | 3.3 | +1.3 | ||
| Turnout | 1,989,441 | 95.1 | -0.7 | ||
Western Australia
| Elected | # | Senator | Party | |
| 1996 | ||||
| 1996 | 1 | Winston Crane | Liberal | |
| 1996 | 2 | Jim McKiernan | Labor | |
| 1996 | 3 | John Panizza | Liberal | |
| 1996 | 4 | Mark Bishop | Labor | |
| 1996 | 5 | Alan Eggleston | Liberal | |
| 1996 | 6 | Andrew Murray | Democrats | |
| 1993 | ||||
| 1993 | 1 | Sue Knowles | Liberal | |
| 1993 | 2 | Peter Cook | Labor | |
| 1993 | 3 | Ian Campbell | Liberal | |
| 1993 | 4 | Chris Evans | Labor | |
| 1993 | 5 | Chris Ellison | Liberal | |
| 1993 | 6 | Dee Margetts | Greens | |
| Party | Candidate | Votes | % | ±% | |
|---|---|---|---|---|---|
| Quota | 143,472 | ||||
| Liberal | 1. Winston Crane (elected 1) 2. John Panizza (elected 3) 3. Alan Eggleston (elected 5) 4. Michael Huston 5. Enzo Sirna 6. Clare Thompson |
460,379 | 45.8 | -2.6 | |
| Labor | 1. Jim McKiernan elected 2) 2. Mark Bishop (elected 4) 3. Michael Beahan 4. Catherine Crawford |
341,580 | 34.1 | -4.1 | |
| Democrats | 1. Andrew Murray (elected 6) 2. Don Millar 3. Shirley de la Hunty |
93,937 | 9.4 | +5.3 | |
| Greens | 1. Christabel Chamarette 2. Robin Chapple |
57,006 | 5.7 | +0.1 | |
| National | 1. Kevin McAnuff 2. Lynley Anderson |
20,877 | 2.0 | +0.3 | |
| AAFI | 1. Richard Haye 2. Robert Hammond |
12,642 | 1.2 | +1.2 | |
| Women's Party | 1. Mattie Turnbull 2. Kate Mudford |
11,169 | 1.1 | +1.1 | |
| Call to Australia | 1. Don Jackson 2. Marj Laurie |
7,028 | 0.7 | -0.5 | |
| Group C | 1. Tony Drake 2. Jean Robinson |
1,518 | 0.1 | +0.1 | |
| Independent | Craig Bradshaw | 1,023 | 0.1 | +0.1 | |
| Natural Law | Ros White | 414 | 0.0 | -0.3 | |
| Independent | Vin Cooper | 376 | 0.0 | 0.0 | |
| Independent | Craig Mackintosh | 346 | 0.0 | 0.0 | |
| Total formal votes | 1,004,299 | 96.5 | -1.4 | ||
| Informal votes | 36,369 | 3.5 | +1.4 | ||
| Turnout | 1,040,668 | 95.6 | -0.3 | ||
South Australia
| Elected | # | Senator | Party | |
| 1996 | ||||
| 1996 | 1 | Robert Hill | Liberal | |
| 1996 | 2 | Rosemary Crowley | Labor | |
| 1996 | 3 | Natasha Stott Despoja | Democrats | |
| 1996 | 4 | Grant Chapman | Liberal | |
| 1996 | 5 | Chris Schacht | Labor | |
| 1996 | 6 | Jeannie Ferris | Liberal | |
| 1993 | ||||
| 1993 | 1 | Amanda Vanstone | Liberal | |
| 1993 | 2 | Nick Bolkus | Labor | |
| 1993 | 3 | Nick Minchin | Liberal | |
| 1993 | 4 | Dominic Foreman | Labor | |
| 1993 | 5 | Alan Ferguson | Liberal | |
| 1993 | 6 | Meg Lees | Democrats | |
| Party | Candidate | Votes | % | ±% | |
|---|---|---|---|---|---|
| Quota | 133,397 | ||||
| Liberal | 1. Robert Hill (elected 1) 2. Grant Chapman (elected 4) 3. Jeannie Ferris (elected 6) 4. Maria Kortesis |
428,053 | 45.8 | +0.1 | |
| Labor | 1. Rosemary Crowley (elected 2) 2. Chris Schacht (elected 5) 3. Deirdre Tedmanson |
301,094 | 32.2 | -5.8 | |
| Democrats | 1. Natasha Stott Despoja (elected 3) 2. Ian Gilfillan 3. Judy Smith 4. Desea Tsagatos |
135,730 | 14.5 | +4.7 | |
| Greens | 1. Stephen Spence 2. Meryl McDougall |
19,441 | 2.0 | +0.4 | |
| AAFI | 1. Bert Joy 2. Stephen Wikblom |
9,424 | 1.0 | +1.0 | |
| Shooters | 1. Haydon Aldersey 2. Robert Low |
8,973 | 1.0 | +1.0 | |
| Grey Power | 1. Emily Gilbey-Riley 2. Gratton Darbyshire |
8,228 | 0.9 | +0.9 | |
| Call to Australia | 1. David Rodway 2. Brett Rodway |
6,817 | 0.7 | -0.4 | |
| Group J | 1. Kenneth Nicholson 2. Colin Shearing |
6,286 | 0.7 | +0.7 | |
| Women's Party | 1. Deborah McCulloch 2. Marg McHugh 3. Denise Tzumli |
5,678 | 0.6 | +0.6 | |
| Independent EFF | 1. David Dwyer 2. Alfred Walker |
2,430 | 0.3 | +0.3 | |
| Group F | 1. Michael Wohltmann 2. Jeanette Wohltmann |
1,081 | 0.1 | +0.1 | |
| Independent | Geoffrey Wells | 561 | 0.1 | +0.1 | |
| Total formal votes | 933,776 | 96.7 | -1.0 | ||
| Informal votes | 31,552 | 3.3 | +1.0 | ||
| Turnout | 965,328 | 96.4 | -0.9 | ||
Tasmania
| Elected | # | Senator | Party | |
| 1996 | ||||
| 1996 | 1 | Jocelyn Newman | Liberal | |
| 1996 | 2 | Sue Mackay | Labor | |
| 1996 | 3 | Paul Calvert | Liberal | |
| 1996 | 4 | Nick Sherry | Labor | |
| 1996 | 5 | John Watson | Liberal | |
| 1996 | 6 | Bob Brown | Greens | |
| 1993 | ||||
| 1993 | 1 | Kay Denman | Labor | |
| 1993 | 2 | Eric Abetz | Liberal | |
| 1993 | 3 | John Coates | Labor | |
| 1993 | 4 | Brian Gibson | Liberal | |
| 1993 | 5 | Brian Harradine | Independent | |
| 1993 | 6 | Shayne Murphy | Labor | |
| Party | Candidate | Votes | % | ±% | |
|---|---|---|---|---|---|
| Quota | 44,139 | ||||
| Liberal | 1. Jocelyn Newman (elected 1) 2. Paul Calvert (elected 3) 3. John Watson (elected 5) |
130,552 | 42.2 | +5.5 | |
| Labor | 1. Sue Mackay (elected 2) 2. Nick Sherry (elected 4) 3. Charles Touber |
120,678 | 39.1 | -3.6 | |
| Greens | 1. Bob Brown (elected 6) 2. Janet Dale |
26,830 | 8.9 | +2.0 | |
| Democrats | 1. Robert Bell 2. Julia Onsman 3. Philip Tattersall |
22,006 | 7.1 | +5.5 | |
| National | 1. Mary Jackson 2. Jeff Clayton |
3,554 | 1.2 | +1.2 | |
| Women's Party | 1. Claire Andersen 2. Lin MacQueen |
1,881 | 0.6 | +0.6 | |
| Natural Law | 1. Gregory Broszczyk 2. James James Harlow |
1,811 | 0.6 | +0.6 | |
| Call to Australia | 1. Don Rogers 2. Beryl Rogers |
1,519 | 0.5 | +0.5 | |
| Total formal votes | 308,970 | 96.8 | -0.6 | ||
| Informal votes | 10,083 | 3.2 | +0.6 | ||
| Turnout | 319,053 | 96.9 | +0.3 | ||
Australian Capital Territory
| Elected | # | Senator | Party | |
| 1996 | ||||
| 1996 | 1 | Kate Lundy | Labor | |
| 1996 | 2 | Margaret Reid | Liberal | |
| Party | Candidate | Votes | % | ±% | |
|---|---|---|---|---|---|
| Quota | 64,020 | ||||
| Labor | 1. Kate Lundy (elected 1) 2. Peter Conway |
81,866 | 42.6 | -6.0 | |
| Liberal | 1. Margaret Reid (elected 2) 2. Stephe Jitts |
74,949 | 39.0 | +4.0 | |
| Democrats | 1. Peter Main 2. Brent Blackburn |
19,590 | 10.2 | +3.3 | |
| Greens | 1. Deb Foskey 2. Jonathan Millar |
11,297 | 5.8 | -0.2 | |
| Call to Australia | 1. John Miller 2. James Liaw |
2,901 | 1.5 | +1.5 | |
| Independent | Fred Skerbic | 1,454 | 0.8 | +0.8 | |
| Independent | Bill Monaghan | 597 | 0.3 | +0.3 | |
| Independent | Joanne Clarke | 454 | 0.2 | +0.2 | |
| Independent | David Seaton | 146 | 0.1 | +0.1 | |
| Total formal votes | 192,057 | 97.5 | -0.9 | ||
| Informal votes | 4,860 | 2.5 | +0.9 | ||
| Turnout | 196,917 | 96.2 | -0.9 | ||
Northern Territory
| Elected | # | Senator | Party | |
| 1996 | ||||
| 1996 | 1 | Grant Tambling | Liberal | |
| 1996 | 2 | Bob Collins | Labor | |
| Party | Candidate | Votes | % | ±% | |
|---|---|---|---|---|---|
| Quota | 28,569 | ||||
| Country Liberal | 1. Grant Tambling (elected 1) 2. Kym Cook |
40,050 | 46.7 | +2.0 | |
| Labor | 1. Bob Collins (elected 2) 2. Susan Bradley |
38,667 | 45.1 | -10.2 | |
| Greens | 1. Margie Friel 2. Ilana Eldridge |
5,453 | 6.4 | +6.4 | |
| Democrats | Geoff Carr | 1,535 | 1.8 | +1.8 | |
| Total formal votes | 85,705 | 97.2 | 0.0 | ||
| Informal votes | 2,422 | 2.8 | 0.0 | ||
| Turnout | 88,127 | 89.2 | +0.2 | ||
External links
This article is issued from Wikipedia. The text is licensed under Creative Commons - Attribution - Sharealike. Additional terms may apply for the media files.