Results of the 2001 Australian federal election (Senate)
The following tables show state-by-state results in the Australian Senate at the 2001 federal election. Senators total 34 coalition (31 Liberal, two coalition National, one CLP), 28 Labor, two Green, one non-coalition National, eight Democrats, two Independents and one One Nation.[1][2] Senator terms are six years (three for territories), and took their seats from 1 July 2002, except the territories who took their seats immediately.
| |||||||||||||||||||||||||||||||||||||||||||||
40 of the 76 seats in the Australian Senate 39 seats needed for a majority | |||||||||||||||||||||||||||||||||||||||||||||
|---|---|---|---|---|---|---|---|---|---|---|---|---|---|---|---|---|---|---|---|---|---|---|---|---|---|---|---|---|---|---|---|---|---|---|---|---|---|---|---|---|---|---|---|---|---|
| |||||||||||||||||||||||||||||||||||||||||||||
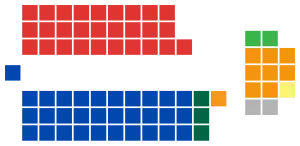 Senators elected in the 2001 federal election | |||||||||||||||||||||||||||||||||||||||||||||
| |||||||||||||||||||||||||||||||||||||||||||||
.jpg.webp)
Australia
| Party | Votes | % | Swing | Seats won | Total seats | Change | |
|---|---|---|---|---|---|---|---|
| Liberal/National Coalition | 4,641,477 | 39.92 | +4.10 | 19 | 34 | 0 | |
| Australian Labor Party | 3,990,997 | 34.42 | -2.99 | 14 | 28 | 0 | |
| Australian Democrats | 843,130 | 7.25 | -1.20 | 4 | 8 | -1 | |
| One Nation | 644,364 | 5.54 | -3.44 | 0 | 1 | 0 | |
| Australian Greens | 574,543 | 4.94 | +2.22 | 2 | 2 | +1 | |
| National Party of Australia (Qld, WA) | 222,860 | 1.92 | +0.06 | 1 | 0 | 0 | |
| Christian Democratic Party | 129,966 | 1.12 | +0.03 | 0 | 0 | 0 | |
| liberals for forests | 87,672 | 0.75 | * | 0 | 0 | 0 | |
| Progressive Labour Party | 76,150 | 0.65 | * | 0 | 0 | 0 | |
| Democratic Labor Party | 66,547 | 0.57 | +0.30 | 0 | 0 | 0 | |
| Help End Marijuana Prohibition | 63,648 | 0.55 | * | 0 | 0 | 0 | |
| No GST Party | 50,053 | 0.43 | +0.29 | 0 | 0 | 0 | |
| Unity Party | 30,193 | 0.26 | -0.57 | 0 | 0 | 0 | |
| The Fishing Party | 27,591 | 0.24 | * | 0 | 0 | 0 | |
| Lower Excise Fuel and Beer Party | 23,767 | 0.20 | * | 0 | 0 | 0 | |
| Australians Against Further Immigration | 21,012 | 0.18 | +0.11 | 0 | 0 | 0 | |
| Republican Party of Australia | 9,939 | 0.09 | +0.08 | 0 | 0 | 0 | |
| Citizens Electoral Council | 8,896 | 0.08 | +0.00 | 0 | 0 | 0 | |
| Reform the Legal System | 8,199 | 0.07 | * | 0 | 0 | 0 | |
| Our Common Future | 5,358 | 0.05 | * | 0 | 0 | 0 | |
| Nuclear Disarmament Party | 4,596 | 0.04 | -0.05 | 0 | 0 | 0 | |
| Non-Custodial Parents Party | 4,071 | 0.04 | +0.04 | 0 | 0 | 0 | |
| Tasmania First Party | 3,895 | 0.03 | -0.01 | 0 | 0 | 0 | |
| Curtin Labor Alliance | 3,494 | 0.03 | * | 0 | 0 | 0 | |
| Hope Party Australia | 2,947 | 0.03 | * | 0 | 0 | 0 | |
| Advance Australia Party | 1,936 | 0.02 | * | 0 | 0 | 0 | |
| Taxi Operators' Political Service | 670 | 0.01 | * | 0 | 0 | 0 | |
| Other | 79,834 | 0.69 | +0.39 | 0 | 2 | 0 | |
| Total | 11,627,529 | 40 | 76 | ||||
New South Wales
| Elected | # | Senator | Party | |
| 2001 | 1 | Helen Coonan | Liberal | |
| 2001 | 2 | Ursula Stephens | Labor | |
| 2001 | 3 | Sandy Macdonald | National | |
| 2001 | 4 | George Campbell | Labor | |
| 2001 | 5 | Marise Payne | Liberal | |
| 2001 | 6 | Kerry Nettle | Greens | |
| 1998 | ||||
| 1998 | 1 | Steve Hutchins | Labor | |
| 1998 | 2 | Bill Heffernan | Liberal | |
| 1998 | 3 | John Faulkner | Labor | |
| 1998 | 4 | John Tierney | Liberal | |
| 1998 | 5 | Aden Ridgeway | Democrats | |
| 1998 | 6 | Michael Forshaw | Labor | |
| Party | Candidate | Votes | % | ±% | |
|---|---|---|---|---|---|
| Quota | 554,207 | ||||
| Coalition | 1. Helen Coonan (Lib) (elected 1) 2. Sandy Macdonald (Nat) (elected 3) 3. Marise Payne (Lib) (elected 5) 4. Fiona Nash (Nat) 5. Scot MacDonald (Lib) 6. Terence Tang (Lib) |
1,620,235 | 41.76 | +3.3 | |
| Labor | 1. Ursula Stephens (elected 2) 2. George Campbell (elected 4) 3. Warren Mundine 4. Joanna Woods |
1,299,488 | 33.50 | -5.0 | |
| Democrats | 1. Vicki Bourne 2. Joanne Yates 3. Craig Chung 4. Caroline Mayfield 5. Janine Prince 6. Julian Evans |
240,867 | 6.21 | -1.1 | |
| One Nation | 1. Don McKinnon 2. Rick Putra 3. Carol Deeney |
216,522 | 5.58 | -4.0 | |
| Greens | 1. Kerry Nettle (elected 6) 2. John Kaye 3. Jan Davis 4. James Ryan |
169,139 | 4.36 | +2.3 | |
| Christian Democrats | 1. George Capsis 2. Kevin Hume |
72,697 | 1.87 | +0.4 | |
| Progressive Labour | 1. Klaas Woldring 2. Shona Lee |
68,483 | 1.77 | +1.8 | |
| HEMP | 1. Michael Balderstone 2. Don Fuggle |
35,526 | 0.92 | +0.9 | |
| Fishing Party | 1. Robert Smith 2. David Wiseman |
27,591 | 0.71 | +0.7 | |
| No GST | 1. Mich Gallagher 2. Charles Martin |
25,734 | 0.66 | +0.5 | |
| Lower Excise Fuel | 1. David O'Loughlin 2. Paul Freeman |
23,767 | 0.61 | +0.6 | |
| AAFI | 1. David Kitson 2. Edwin Woodger |
21,012 | 0.54 | +0.3 | |
| Unity | 1. Thang Ngo 2. Robert McLeod |
19,731 | 0.51 | -1.1 | |
| Legal System Reform | 1. Denise Greenaway 2. Valerie Armstrong |
8,199 | 0.21 | +0.2 | |
| Our Common Future | 1. Helen Caldicott 2. Ted Potts |
5,358 | 0.14 | +0.1 | |
| Republican | 1. Kerry McNally 2. Tom Jordan |
5,101 | 0.13 | +0.1 | |
| Nuclear Disarmament | 1. Michael Denborough 2. Yvonne Francis |
4,596 | 0.12 | -0.1 | |
| Non-Custodial Parents | 1. Andy Thompson 2. Annette McKeegan |
4,071 | 0.10 | +0.1 | |
| Group L | 1. Lex Stewart 2. John Stewart |
2,402 | 0.06 | +0.06 | |
| CEC | 1. Robert Butler 2. Clenys Collins |
2,370 | 0.06 | +0.0 | |
| Advance Australia | 1. Rex Connor 2. Robert Astridge 3. Shirley Guy |
1,936 | 0.05 | +0.05 | |
| Group U | 1. Pip Hinman 2. Ian Rintoul |
1,364 | 0.04 | +0.04 | |
| Group N | 1. Warren Smith 2. Geoff Lawler 3. Dora Anthony |
1,241 | 0.03 | +0.03 | |
| Independent | Beverly Baker | 971 | 0.03 | +0.03 | |
| Independent | F Ivor | 703 | 0.02 | +0.02 | |
| Independent | Jack Lord | 237 | 0.01 | +0.01 | |
| Independent | Walter Tinyow | 102 | 0.01 | +0.01 | |
| Total formal votes | 3,879,443 | 96.46 | -0.23 | ||
| Informal votes | 142,281 | 3.54 | +0.23 | ||
| Turnout | 4,021,724 | 95.66 | -0.68 | ||
Victoria
| Elected | # | Senator | Party | |
| 2001 | 1 | Richard Alston | Liberal | |
| 2001 | 2 | Robert Ray | Labor | |
| 2001 | 3 | Rod Kemp | Liberal | |
| 2001 | 4 | Gavin Marshall | Labor | |
| 2001 | 5 | Kay Patterson | Liberal | |
| 2001 | 6 | Lyn Allison | Democrats | |
| 1998 | ||||
| 1998 | 1 | Stephen Conroy | Labor | |
| 1998 | 2 | Judith Troeth | Liberal | |
| 1998 | 3 | Kim Carr | Labor | |
| 1998 | 4 | Julian McGauran | National | |
| 1998 | 5 | Jacinta Collins | Labor | |
| 1998 | 6 | Tsebin Tchen | Liberal | |
| Party | Candidate | Votes | % | ±% | |
|---|---|---|---|---|---|
| Quota | 416,896 | ||||
| Coalition | 1. Richard Alston (Lib) (elected 1) 2. Rod Kemp (Lib) (elected 3) 3. Kay Patterson (Lib) (elected 5) 4. Tim Hawker (Nat) 5. Dino de Marchi (Lib) 6. Duc-Dung Tran (Lib) |
1,155,817 | 39.61 | +1.8 | |
| Labor | 1. Robert Ray (elected 2) 2. Gavin Marshall (elected 4) 3. Ted Murphy 4. Robert Chong |
1,073,632 | 36.79 | -3.7 | |
| Democrats | 1. Lyn Allison (elected 6) 2. Pierre Harcourt 3. David Wark 4. Simone Alesich |
228,212 | 7.82 | -2.0 | |
| Greens | 1. Scott Kinnear 2. Eleisha Mullane 3. Dinesh Mathew 4. Liz Conor |
174,756 | 4.36 | +3.5 | |
| One Nation | 1. Robyn Spencer 2. Neville McIntyre |
71,598 | 2.45 | -1.6 | |
| Liberals for Forests | 1. Suresh Pathy 2. John Lugg |
70,134 | 2.40 | +2.4 | |
| Democratic Labor | 1. John Mulholland 2. Pat Crea 3. Gail King 4. Rosemary Maurus 5. Ken Wells |
66,547 | 2.28 | +0.0 | |
| Group C | 1. Phil Cleary 2. Eileen Zombolas |
36,142 | 1.24 | +1.24 | |
| Christian Democrats | 1. Murray Graham 2. Arnold Jago |
17,155 | 0.59 | +0.1 | |
| Unity | 1. Wellington Lee 2. Diana Wolowski 3. Bill Cope (academic) |
9,651 | 0.33 | -0.4 | |
| CEC | 1. Noelene Isherwood 2. Robert Barwick |
2,660 | 0.09 | +0.1 | |
| Group J | 1. A.T. Baker 2. Pam Barber |
2,585 | 0.09 | +0.09 | |
| Hope | 1. Tim Petherbridge 2. Lee-Anne Poynton |
2,581 | 0.09 | +0.1 | |
| Group Q | 1. Alison Thorne 2. Sarah Peart 3. Tony Dewberry |
1,730 | 0.06 | +0.06 | |
| Group F | 1. Steve Raskovy 2. Elizabeth Kennedy |
1,496 | 0.05 | +0.05 | |
| Group E | 1. Joseph Toscano 2. Stephen Reghenzani |
1,391 | 0.05 | +0.05 | |
| Group N | 1. Craig Davis 2. Donna Brocas |
700 | 0.02 | +0.02 | |
| Independent | Daniel Flood | 589 | 0.02 | +0.02 | |
| Independent | Isaac Gnieslaw | 559 | 0.02 | +0.02 | |
| Independent | Richard Maslowski | 105 | 0.01 | +0.01 | |
| Total formal votes | 2,918,267 | 94.40 | -1.82 | ||
| Informal votes | 173,141 | 5.60 | +1.82 | ||
| Turnout | 3,091,408 | 96.04 | -0.55 | ||
Queensland
| Elected | # | Senator | Party | |
| 2001 | 1 | Ian Macdonald | Liberal | |
| 2001 | 2 | John Hogg | Labor | |
| 2001 | 3 | John Herron | Liberal | |
| 2001 | 4 | Claire Moore | Labor | |
| 2001 | 5 | Andrew Bartlett | Democrats | |
| 2001 | 6 | Ron Boswell | National | |
| 1998 | ||||
| 1998 | 1 | Jan McLucas | Labor | |
| 2000* | 2 | George Brandis | Liberal | |
| 1999† | 3 | Len Harris | One Nation | |
| 1998 | 4 | Joe Ludwig | Labor | |
| 1998 | 5 | Brett Mason | Liberal | |
| 2001‡ | 6 | John Cherry | Democrats | |
| Party | Candidate | Votes | % | ±% | |
|---|---|---|---|---|---|
| Quota | 307,154 | ||||
| Liberal | 1. Ian Macdonald (elected 1) 2. John Herron (elected 3) 3. Russell Trood 4. Deborah Kember |
750,416 | 34.90 | +9.0 | |
| Labor | 1. John Hogg (elected 2) 2. Claire Moore (elected 4) 3. Brenda Gibbs |
682,239 | 31.73 | -0.9 | |
| One Nation | 1. Pauline Hanson 2. Trevor Hansen 3. Morrie Marsden 4. John Slack-Smith |
215,400 | 10.02 | -4.8 | |
| National | 1. Ron Boswell (elected 6) 2. Pam Stallman 3. Barnaby Joyce |
196,845 | 9.16 | -0.3 | |
| Democrats | 1. Andrew Bartlett (elected 5) 2. Liz Oss-Emer 3. Megan Bathurst |
143,942 | 6.69 | -1.0 | |
| Greens | 1. Sarah Moles 2. Desiree Mahoney 3. Mark Taylor |
71,102 | 3.31 | +1.2 | |
| HEMP | 1. Nigel Freemarijuana 2. Guy Freemarijuana |
28,122 | 1.31 | +1.3 | |
| No GST | 1. David Ettridge 2. Richard Gooch |
24,319 | 1.13 | -1.0 | |
| Christian Democrats | 1. Kerry Blackman 2. Geoffrey Bullock |
22,703 | 1.06 | -0.3 | |
| Group A | 1. Sam Watson 2. Karen Fletcher |
8,553 | 0.40 | +0.40 | |
| Republican | 1. John Pyke 2. Malcolm Simpson |
2,553 | 0.12 | +0.1 | |
| CEC | 1. Danny Hope 2. Nick Contarino |
2,226 | 0.10 | +0.10 | |
| Independent | Derek Rosborough | 700 | 0.03 | +0.03 | |
| Independent | Phillip Riley | 263 | 0.01 | +0.01 | |
| Independent | George Szentes | 180 | 0.01 | +0.01 | |
| Independent | Oni Kirwin | 173 | 0.01 | +0.01 | |
| Independent | Anthony Melrose | 105 | 0.01 | +0.01 | |
| Independent | John Jones | 86 | 0.01 | +0.01 | |
| Independent | David Howse | 78 | 0.01 | +0.01 | |
| Independent | Walter Philippi | 72 | 0.01 | +0.01 | |
| Total formal votes | 2,150,077 | 97.05 | +0.09 | ||
| Informal votes | 65,450 | 2.95 | -0.09 | ||
| Turnout | 2,215,527 | 95.23 | +0.33 | ||
Western Australia
| Elected | # | Senator | Party | |
| 2001 | 1 | Alan Eggleston | Liberal | |
| 2001 | 2 | Mark Bishop | Labor | |
| 2001 | 3 | David Johnston | Liberal | |
| 2001 | 4 | Ruth Webber | Labor | |
| 2001 | 5 | Ross Lightfoot | Liberal | |
| 2001 | 6 | Andrew Murray | Democrats | |
| 1998 | ||||
| 1998 | 1 | Chris Ellison | Liberal | |
| 1998 | 2 | Peter Cook | Labor | |
| 1998 | 3 | Ian Campbell | Liberal | |
| 1998 | 4 | Chris Evans | Labor | |
| 1998 | 5 | Brian Greig | Democrats | |
| 1998 | 6 | Sue Knowles | Liberal | |
| Party | Candidate | Votes | % | ±% | |
|---|---|---|---|---|---|
| Quota | 157,933 | ||||
| Liberal | 1. Alan Eggleston (elected 1) 2. David Johnston (elected 3) 3. Ross Lightfoot (elected 5) 4. Winston Crane 5. Kim Keogh 6. Nigel Hallett |
443,597 | 40.13 | +1.7 | |
| Labor | 1. Mark Bishop (elected 2) 2. Ruth Webber (elected 4) 3. Mark Cuomo 4. Gavin Waugh |
377,547 | 34.15 | -0.4 | |
| One Nation | 1. Graeme Campbell 2. Gerry Kenworthy 3. Marye Daniels 4. Peter David |
77,757 | 7.03 | -3.0 | |
| Democrats | 1. Andrew Murray (elected 6) 2. Helen Hodgson 3. Damian Meyer |
64,773 | 5.86 | -0.5 | |
| Greens | 1. Rachel Siewert 2. Lee Bell 3. Paul Smith 4. Jenna Zed |
64,736 | 5.86 | +0.2 | |
| National | 1. Hendy Cowan 2. Margaret Day |
26,015 | 2.35 | +1.2 | |
| Liberals for Forests | 1. Liz Davenport 2. Arthur Harris |
15,646 | 1.42 | +1.4 | |
| Christian Democrats | 1. Justin Moseley 2. Kerry Watterson |
13,809 | 1.25 | +0.4 | |
| Progressive Labour | 1. Eddie Hwang 2. Nicholas Chin |
7,667 | 0.69 | +0.7 | |
| Group A | 1. Jim Dalton 2. Kate Dalton |
4,495 | 0.41 | +0.4 | |
| Curtin Labor Alliance | 1. Adrian Bennett 2. June Bennett |
3,494 | 0.32 | +0.3 | |
| Group B | 1. Geoff Taylor 2. Henry Sheil |
1,631 | 0.15 | +0.2 | |
| CEC | 1. Jean Robertson 2. John Watson |
1,243 | 0.11 | +0.0 | |
| Unity | 1. Eddie Hwang 2. Nicholas Chin |
811 | 0.07 | -1.0 | |
| Independent | Jennifer Lee | 804 | 0.07 | +0.1 | |
| Taxi Operators | 1. Alan Bateson 2. Ramon Kennedy |
670 | 0.06 | +0.06 | |
| Group K | 1. Frank Nesci 2. Renu Schneider |
532 | 0.05 | +0.05 | |
| Group M | 1. Clarrie Isaacs 2. Daniel Watson |
302 | 0.03 | +0.03 | |
| Total formal votes | 1,105,529 | 96.42 | -0.63 | ||
| Informal votes | 41,025 | 3.58 | +0.63 | ||
| Turnout | 1,146,554 | 95.04 | -0.78 | ||
South Australia
| Elected | # | Senator | Party | |
| 2001 | 1 | Robert Hill | Liberal | |
| 2001 | 2 | Penny Wong | Labor | |
| 2001 | 3 | Jeannie Ferris | Liberal | |
| 2001 | 4 | Linda Kirk | Labor | |
| 2001 | 5 | Grant Chapman | Liberal | |
| 2001 | 6 | Natasha Stott Despoja | Democrats | |
| 1998 | ||||
| 1998 | 1 | Amanda Vanstone | Liberal | |
| 1998 | 2 | Nick Bolkus | Labor | |
| 1998 | 3 | Nick Minchin | Liberal | |
| 1998 | 4 | John Quirke | Labor | |
| 1998 | 5 | Meg Lees | Democrats | |
| 1998 | 6 | Alan Ferguson | Liberal | |
| Party | Candidate | Votes | % | ±% | |
|---|---|---|---|---|---|
| Quota | 138,146 | ||||
| Liberal | 1. Robert Hill (elected 1) 2. Jeannie Ferris (elected 3) 3. Grant Chapman (elected 5) 4. Michelle Lensink |
440,537 | 45.53 | +5.0 | |
| Labor | 1. Penny Wong (elected 2) 2. Linda Kirk (elected 4) 3. Chris Schacht |
321,551 | 33.23 | -1.3 | |
| Democrats | 1. Natasha Stott Despoja (elected 6) 2. Jeff Heath 3. Michael Pilling 4. Haroon Hassan |
122,195 | 12.63 | +0.3 | |
| One Nation | 1. Neil Russell-Taylor 2. Colin Gibson |
44,080 | 4.56 | -5.0 | |
| Greens | 1. Cate Faehrmann 2. Jim Douglas |
33,439 | 3.46 | +1.3 | |
| Republican | 1. Patrick Crozier 2. Robert Easson |
1,917 | 0.20 | +0.20 | |
| Group D | 1. Kathy Newnam 2. Lisa Lines |
1,171 | 0.12 | +0.12 | |
| Group G | 1. Kerry Harte 2. Colin Phillips |
886 | 0.09 | +0.09 | |
| Group F | 1. Mark Aldridge 2. Helen Aldridge |
750 | 0.08 | +0.08 | |
| Independent | Kym Fishlock | 596 | 0.06 | +0.06 | |
| Independent | Nicholas McShane | 309 | 0.03 | +0.03 | |
| CEC | Ervyn Behn | 106 | 0.01 | +0.00 | |
| Total formal votes | 967,015 | 96.94 | -0.25 | ||
| Informal votes | 30,561 | 3.06 | +0.25 | ||
| Turnout | 997,576 | 96.22 | -0.58 | ||
Tasmania
| Elected | # | Senator | Party | |
| 2001 | 1 | Paul Calvert | Liberal | |
| 2001 | 2 | Sue Mackay | Labor | |
| 2001 | 3 | John Watson | Liberal | |
| 2001 | 4 | Nick Sherry | Labor | |
| 2001 | 5 | Bob Brown | Greens | |
| 2001 | 6 | Richard Colbeck | Liberal | |
| 1998 | ||||
| 1998 | 1 | Kerry O'Brien | Labor | |
| 1998 | 2 | Eric Abetz | Liberal | |
| 1998 | 3 | Shayne Murphy | Independent* | |
| 1998 | 4 | Brian Gibson | Liberal | |
| 1998 | 5 | Kay Denman | Labor | |
| 1998 | 6 | Brian Harradine | Independent | |
| Party | Candidate | Votes | % | ±% | |
|---|---|---|---|---|---|
| Quota | 44,095 | ||||
| Liberal | 1. Paul Calvert (elected 1) 2. John Watson (elected 3) 3. Richard Colbeck (elected 6) |
119,720 | 38.79 | +6.1 | |
| Labor | 1. Sue Mackay (elected 2) 2. Nick Sherry (elected 4) 3. Catryna Bilyk |
113,709 | 36.84 | -4.6 | |
| Greens | Bob Brown (elected 5) | 42,568 | 13.79 | +8.0 | |
| Democrats | 1. Debbie Butler 2. Brendan Toohey |
14,273 | 4.62 | +0.7 | |
| One Nation | 1. Bronwyn Boag 2. Peter Stokes |
10,169 | 3.29 | -0.4 | |
| Tasmania First | 1. Merilyn Crack 2. David Jackson 3. John Presser |
3,895 | 1.26 | -0.2 | |
| Liberals for Forests | 1. Peter Pullinger 2. Michael Thomas |
1,892 | 0.61 | +0.6 | |
| Independent | Eric Lockett | 464 | 0.15 | +0.1 | |
| Group D | 1. Stephen Bonner 2. Geoff Howard |
414 | 0.13 | +0.1 | |
| Group G | 1. Alex Bainbridge 2. Sarah Cleary |
389 | 0.13 | +0.1 | |
| Republican | 1. Peter Consandine 2. Bert Lawatsch |
368 | 0.12 | +0.0 | |
| Hope | 1. James Bristow 2. Shamara Petherbridge-de Tissera |
368 | 0.12 | +0.12 | |
| Independent | Helen Lane | 268 | 0.09 | +0.09 | |
| Independent | John Marmarinos | 85 | 0.03 | +0.03 | |
| CEC | Rob Larner | 82 | 0.03 | +0.03 | |
| Total formal votes | 308,662 | 96.71 | -0.23 | ||
| Informal votes | 10,493 | 3.29 | +0.23 | ||
| Turnout | 319,155 | 96.83 | +0.37 | ||
Territories
Australian Capital Territory
| Elected | # | Senator | Party | |
| 2001 | 1 | Kate Lundy | Labor | |
| 2001 | 2 | Margaret Reid | Liberal | |
| Party | Candidate | Votes | % | ±% | |
|---|---|---|---|---|---|
| Quota | 68,492 | ||||
| Labor | 1. Kate Lundy (elected 1) 2. Robin Poke |
86,331 | 42.02 | -1.0 | |
| Liberal | 1. Margaret Reid (elected 2) 2. Bill Hanlon |
70,475 | 34.30 | +3.0 | |
| Democrats | 1. Wayne Sievers 2. Roslyn Dundas |
22,072 | 10.74 | -6.2 | |
| Greens | 1. Gary Corr 2. Felicity Fahey |
14,825 | 7.22 | +4.0 | |
| One Nation | 1. Don Tarlinton 2. Ted Tarlinton |
4,485 | 2.18 | -2.2 | |
| Christian Democrats | 1. Ian McClure 2. Tim Janes |
3,602 | 1.25 | +0.8 | |
| Independent | Ken Helm | 3,580 | 1.74 | +1.74 | |
| CEC | James Arnold | 104 | 0.05 | +0.05 | |
| Total formal votes | 205,474 | 97.66 | -0.37 | ||
| Informal votes | 4,924 | 2.34 | +0.37 | ||
| Turnout | 210,398 | 95.69 | -0.62 | ||
Northern Territory
| Elected | # | Senator | Party | |
| 2001 | 1 | Nigel Scullion | CLP | |
| 2001 | 2 | Trish Crossin | Labor | |
| Party | Candidate | Votes | % | ±% | |
|---|---|---|---|---|---|
| Quota | 31,021 | ||||
| Country Liberal | 1. Nigel Scullion (elected 1) 2. John Lopes |
40,680 | 43.71 | +4.9 | |
| Labor | 1. Trish Crossin (elected 2) 2. Olga Havnen |
36,500 | 39.22 | -2.0 | |
| Democrats | 1. David Curtis 2. Joe Faggion |
6,796 | 7.30 | +2.8 | |
| One Nation | 1. Rob Phillips 2. Jim King |
4,353 | 4.68 | -4.6 | |
| Greens | 1. Melanie Ross 2. Charlotte McCabe |
3,978 | 4.27 | +0.2 | |
| Group D | 1. June Mills 2. Gary Meyerhoff |
650 | 0.70 | +0.70 | |
| CEC | Peter Flynn | 105 | 0.11 | +0.11 | |
| Total formal votes | 93,062 | 97.24 | -0.76 | ||
| Informal votes | 1,901 | 2.76 | +0.76 | ||
| Turnout | 95,702 | 86.20 | -4.40 | ||
External links
This article is issued from Wikipedia. The text is licensed under Creative Commons - Attribution - Sharealike. Additional terms may apply for the media files.