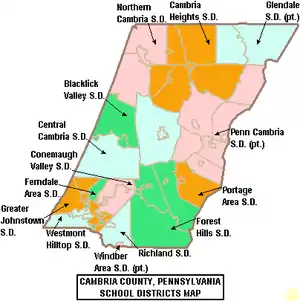
Richland School District (Cambria County, Pennsylvania)
The Richland School District is a small, rural, public school district in Cambria County, Pennsylvania. It serves the borough of Geistown and the Township of Richland. It encompasses approximately 22 square miles. According to 2010 federal census data, the district served a resident population of 14,902 people.[8] The educational attainment levels for the School District population (25 years old and over) were 90% high school graduates and 26.8% college graduates.[9] The district is one of the 500 public school districts of Pennsylvania.
| Richland School District | |
|---|---|
 | |
| Address | |
| |
1 Academic Avenue, Suite 200 , Cambria County , 15904 United States | |
| Information | |
| Closed | Richland MS July 2007, Richland SHS, 2007, Rachel Hill ES (1998) |
| School board | 9 locally elected members |
| Superintendent | Arnold J Nadonley, MEd |
| Administrator | Brandon Bailey, Director of Educational Services |
| Principal | Timothy Regan, HS Principal / Mark Mosorjak HS Assistant Principal |
| Principal | Gregg Wilson, ES/ / Kelly Lashinsky ES Assistant Principal |
| Staff | 43 non-teaching staff members (2012)[1] |
| Faculty | 107 teachers (2017) |
| Grades | K-12 |
| Age | 5 years old to 21 years old special education |
| Enrollment | 1,632 pupils (2014)[2] 1,605 pupils (2006) |
| • Kindergarten | 122 (2013),[5] 87 (2010) |
| • Grade 1 | 111 (2013), 117 |
| • Grade 2 | 124 (2013), 112 |
| • Grade 3 | 122 (2013), 121 |
| • Grade 4 | 98 (2013), 122 |
| • Grade 5 | 129 (2013), 122 |
| • Grade 6 | 138 (2013), 123 |
| • Grade 7 | 123 (2013), 120 |
| • Grade 8 | 136 (2013), 136 |
| • Grade 9 | 130 (2013), 164 |
| • Grade 10 | 122 (2013), 105 |
| • Grade 11 | 126 (2013), 132 |
| • Grade 12 | 151 (2013), 140 (2010) |
| Language | English |
| Color(s) | Red, white, blue |
| Team name | Rams |
| Budget | $21,771,649 (2015-16)[6] $21.2 million (2013-14)[7] |
| Per-pupil spending | $13,259 (2008) |
| Per-pupil spending | $11,887.39 (2012) |
| Website | richlandsd |
According to the Pennsylvania Budget and Policy Center, 23.6% of the district's pupils lived at 185% or below the Federal Poverty Level as shown by their eligibility for the federal free or reduced price school meal programs in 2012.[10] In 2009 the Richland School District residents' per capita income was $18,883, while the median family income was $45,694.[11] In the Commonwealth, the median family income was $49,501[12] and the United States median family income was $49,445, in 2010.[13] In Cambria County, the median household income was $39,574.[14] By 2013, the median household income in the United States rose to $52,100.[15] In 2014, the median household income in the USA was $53,700.[16]
Per District officials, in school year 2016–2017, the Richland School District provided basic educational services to 1,578 pupils. It employed: 107 teachers, 40 full-time and part-time support personnel, 8 administrators, and contracted with Richland Township Police Department to provide a full-time school resource officer.
The Richland School District operates two schools: Richland Elementary School (Grades K-6) and Richland High School (Grades 7-12). High school students may choose to attend Greater Johnstown Career and Technology Center for training in the construction and mechanical trades. The Appalachia Intermediate Unit IU8 provides the district with a wide variety of services like specialized education for disabled students and hearing, background checks for employees, state mandated recognizing and reporting child abuse training, speech and visual disability services and professional development for staff and faculty.
Governance
Richland School District is governed by 9 individually elected board members (serve four-year terms), the Pennsylvania State Board of Education, the Pennsylvania Department of Education and the Pennsylvania General Assembly.[17] The superintendent and business manager are appointed by the school board. The superintendent is the chief administrative officer with overall responsibility for all aspects of operations, including education and finance. The business manager is responsible for budget and financial operations. Neither of these officials are voting members of the school board. The school board enters into individual employment contracts for these positions. In Pennsylvania, public school districts are required to give 150 days notice to the superintendent regarding renewal of the employment contract.[18]
Academic achievement
Richland School District ranked 111th out of 493 Pennsylvania public school districts, by the Pittsburgh Business Times in 2015.[19] The statewide ranking is based on the last 3 years of student academic achievement as demonstrated by PSSAs results in: reading, writing, math and science and the three Keystone Exams (literature, Algebra 1, Biology I) in high school.[20] Three school districts were excluded because they do not operate high schools (Saint Clair Area School District, Midland Borough School District, Duquesne City School District). The PSSAs are given to all children in grades 3rd through 8th. Adapted PSSA examinations are given to children in the special education programs. Writing exams were given to children in 5th and 8th grades.
|
|
|
In 2009, the academic achievement of the students of Richland School District was in the 86th percentile among 500 Pennsylvania school districts. Scale - (0-99; 100 is state best)[27]
District AYP status history
In 2012, Richland School District achieved Adequate Yearly Progress (AYP) status.[28] In 2011, Richland School District achieved Adequate Yearly Progress (AYP). In 2011, 94 percent of the 500 Pennsylvania public school districts achieved the No Child Left Behind Act progress level of 72% of students reading on grade level and 67% of students demonstrating on grade level math. In 2011, 46.9 percent of Pennsylvania school districts achieved Adequate Yearly Progress (AYP) based on student performance. An additional 37.8 percent of Pennsylvania public school districts made AYP based on a calculated method called safe harbor, 8.2 percent on the growth model and 0.8 percent on a two-year average performance.[29][30] Richland School District achieved AYP status each year from 2004 to 2010, while in 2003 the district was in Warning status due to lagging student achievement.[31]
Graduation rate
In 2014, the district's graduation rate was 92%.[32]
- 2013 - 80% [33]
- 2012 - 95%
- 2011 - 96%.[34]
- 2010 - 95%, Pennsylvania Department of Education issued a new, 4-year cohort graduation rate.[35]
- According to traditional graduation rate calculations
Richland High School
Richland High School is located at One Academic Avenue, Johnstown. In 2014, enrollment was reported as 788 pupils in 7th through 12th grades, with 22.6% of pupils eligible for a free lunch due to family poverty. Additionally, 8.6% of pupils received special education services, while 2% of pupils were identified as gifted.[38] The school employed 43 teachers.[39] Per the PA Department of Education, 2% of the teachers were rated "Non‐Highly Qualified" under the federal No Child Left Behind Act. The school is not a Title I school.
According to the National Center for Education Statistics, in 2012, the school reported an enrollment of 771 pupils in grades 7th through 12th, with 117 pupils eligible for a federal free or reduced-price lunch due to the family meeting the federal poverty level. In 2012, the school employed 43 teachers, yielding a student-teacher ratio of 17.7:1.[40] According to a report by the Pennsylvania Department of Education, 19% of courses were taught by teachers who were rated "Non‐Highly Qualified" under No Child Left Behind.[41]
- 2014 School Performance Profile
Richland High School achieved 83.5 out of 100. Reflects on grade level reading, mathematics and science achievement. In reading/literature - 85.9% of pupils were reading on grade level. In Mathematics/Algebra 1, 83% showed on grade level math skills. In Science/Biology 1, 72% demonstrated on grade level science understanding at the end of the course. In Writing - 73% of 8th graders demonstrated on grade level writing skills.[42][43] Statewide, the percentage of high school students who scored proficient and advanced in Algebra I increased to 39.7% to 40.1%. The percentage of high school students who scored proficient and advanced in reading/literature declined to 52.5%. The percentage of high school students who scored proficient and advanced in biology improved from 39.7% to 41.4%.[44]
According to the Pennsylvania Department of Education, 2,134 of 2,947 Pennsylvania public schools (72 percent of Pennsylvania public schools), achieved an academic score of 70 or higher.[45] Fifty-three percent of schools statewide received lower SPP scores compared with last year's, while 46 percent improved. A handful were unchanged.[46][47]
- 2013 School Performance Profile
Richland High School achieved 80.2 out of 100. Reflects on grade level reading, mathematics and science achievement. In reading/literature - 86% of pupils were on grade level. In math/Algebra 1, 74% showed on grade level mathematics skills. In science/Biology, 71.8% showed on grade level science understanding. In writing, 71% of 8th graders demonstrated on grade level writing skills.[48] According to the Pennsylvania Department of Education, 2,181 public schools (less than 73 percent of Pennsylvania public schools), achieved an academic score of 70 or higher. Pennsylvania 11th grade students no longer take the PSSAs. Instead, beginning in 2012, they take the Keystone Exams at the end of the associated course.[49]
- AYP History
In 2012, Richland High School achieved Adequate Yearly Progress (AYP) status.[50] In 2009 through 2011, Richland High School achieved AYP status.[51] In 2008, Richland High School was in Warning AYP status due to lagging student academic achievement.[52] AYP status for Richland High School was not reported prior to 2008 due to the district combining 7th through 12th grades in one school building. Earlier AYP reporting was under Richland Middle School and Richland Senior High School.[53]
- PSSAs
Pennsylvania System of School Assessments, commonly called PSSAs are No Child Left Behind Act related examinations which were administered from 2003 through 2012, in all Pennsylvania public high schools. The exams were administered in the Spring of each school year. The goal was for 100% of students to be on grade level or better in reading and mathematics, by the Spring of 2014. The tests focused on the state's Academic Standards for reading, writing, mathematics and science. The Science exam included content in science, technology, ecology and the environmental studies. The mathematics exam included: algebra I, algebra II, geometry and trigonometry. The standards were first published in 1998 and are mandated by the Pennsylvania State Board of Education.[54] In 2013, the Commonwealth of Pennsylvania changed its high school assessments to the Keystone Exams in Algebra 1, Reading/literature and Biology1. The exams are given at the end of the course, rather than all in the spring of the student's 11th grade year.[55] Effective with Spring 2013, the Pennsylvania Department of Education discontinued administering the PSSA's to 11th graders.
11th Grade Reading
- 2012 - 87% on grade level, (5% below basic). State - 67% of 11th graders are on grade level.[56]
- 2011 - 74% (11% below basic). State - 69.1%[57]
- 2010 - 81% (9% below basic). State - 66%[58]
- 2009 - 77% (9% below basic). State - 65%[59]
- 2008 - 73% (11% below basic). State - 65%[60]
- 2007 - 88% (6% below basic). State - 65%[61]
11th Grade Math:
- 2012 - 70% on grade level (17% below basic). In Pennsylvania, 59% of 11th graders are on grade level.[62]
- 2011 - 61%, (22% below basic). State - 60.3%[63]
- 2010 - 68%, (17% below basic). State - 59%
- 2009 - 60% (15.5% below basic). State - 56%.
- 2008 - 58% (17% below basic). State - 56%
- 2007 - 70% (9% below basic). State - 53%
11th Grade Science:
College remediation rate
According to a Pennsylvania Department of Education study released in January 2009, 10% of the Richland High School graduates required remediation in mathematics and or reading before they were prepared to take college level courses in the Pennsylvania State System of Higher Education or community colleges.[67] Less than 66% of Pennsylvania high school graduates, who enroll in a four-year college in Pennsylvania, will earn a bachelor's degree within six years. Among Pennsylvania high school graduates pursuing an associate degree, only one in three graduate in three years.[68] Per the Pennsylvania Department of Education, one in three recent high school graduates who attend Pennsylvania's public universities and community colleges takes at least one remedial course in math, reading or English.
Graduation requirements
The Richland School Board has determined that a pupil must earn 25 credits to graduate, including: Math 4 credits, English 4 credits, Social Studies 4 credits, Science 3 credits, Physical Education 1.6 credits, Health 0.6 credits, Arts/Humanities 2 credits and electives 5.8 credits.[69] The district offers a Learn and Earn program where students may take a reduced course load their senior year, giving them time to take college courses or work. The high school also has an Associate in High School plan which allows students to accelerate their studies and earn two years of college credits.[70]
By law, all Pennsylvania secondary school students must complete a project as a part of their eligibility to graduate from high school. The type of project, its rigor and its expectations are set by the individual school district.[71] Effective with the graduating class of 2017, the Pennsylvania State Board of Education eliminated the state mandate that students complete a culminating project in order to graduate.[72]
By Pennsylvania State School Board regulations, beginning with the class of 2017, public school students must demonstrate successful completion of secondary level course work in Algebra I, Biology, and English Literature by passing the respective Keystone Exams for each course.[73] The exam is given at the end of the course. Keystone Exams replace the PSSAs for 11th grade.[74]
Students have several opportunities to pass the exam. Schools are mandated to provide targeted assistance to help the student be successful. Those who do not pass after several attempts can perform a project in order to graduate.[75][76] For the class of 2019, a Composition exam will be added. For the class of 2020, passing a civics and government exam will be added to the graduation requirements.[77] In 2011, Pennsylvania high school students field tested the Algebra 1, Biology and English Lit exams. The statewide results were: Algebra 1 38% on grade level, Biology 35% on grade level and English Lit - 49% on grade level.[78] Individual student, school or district reports were not made public, although they were reported to district officials by the Pennsylvania Department of Education. Students identified as having special needs and qualifying for an Individual Educational Program (IEP) may graduate by meeting the requirements of their IEP.
Challenge Program
The Challenge Program offers $250.00 cash incentives to Senior High School students who excel in the categories of: Academic Improvement, Attendance, Community Service and Academic Excellence. The program partners with businesses to motivate students both in and out of the classroom by encouraging good habits in students that will last throughout their education and into their future careers. For the 2010–2011 school year, the top 10% of students in each of the categories will be eligible to win $250.00.[79]
SAT scores
In 2014, 111 Richland School District students took the SAT exams. The district's Verbal Average Score was 492. The Math average score was 501. The Writing average score was 503.[80][81] Statewide in Pennsylvania, Verbal Average Score was 497. The Math average score was 504. The Writing average score was 480. The College Board also reported that nationwide scores were: 497 in reading, 513 in math and 487 in writing.[82] In 2014, 1,672,395 students took the SATs in the United States.
In 2013, 95 Richland School District students took the SAT exams. The College Board reported that statewide scores were: 494 in reading, 504 in math and 482 in writing. The nationwide SAT results were the same as in 2012.[83]
In 2012, 95 Richland School District students took the SAT exams. The district's Verbal Average Score was 493. The Math average score was 498. The Writing average score was 495. The statewide Verbal SAT exams results were: Verbal 491, Math 501, Writing 480. In the US, 1.65 million students took the exams achieving scores: Verbal 496, Math 514, Writing 488. According to the College Board the maximum score on each section was 800, and 360 students nationwide scored a perfect 2,400.
In 2011, 82 School District students took the SAT exams. The district's Verbal Average Score was 505. The Math average score was 492. The Writing average score was 493.[84] Pennsylvania ranked 40th among states with SAT scores: Verbal - 493, Math - 501, Writing - 479.[85] In the United States, 1.65 million students took the exam in 2011. They averaged 497 (out of 800) verbal, 514 math and 489 in writing.[86]
In 2011, 110 Richland School District students took the SAT exams. The district's Verbal Average Score was 484. The Math average score was 493. The Writing average score was 470.[84] Pennsylvania ranked 40th among states with SAT scores: Verbal - 493, Math - 501, Writing - 479.[85] In the United States, 1.65 million students took the exam in 2011. They averaged 497 (out of 800) verbal, 514 math and 489 in writing.[86]
The Center for Rural Pennsylvania, a research arm of the Pennsylvania General Assembly, compared the SAT data of students in rural areas of Pennsylvania to students in urban areas. From 2003 to 2005, the average total SAT score for students in rural Pennsylvania was 992, while urban students averaged 1,006. During the same period, 28 percent of 11th and 12th graders in rural school districts took the exam, compared to 32 percent of urban students in the same grades. The average math and verbal scores were 495 and 497, respectively, for rural students, while urban test-takers averaged 499 and 507, respectively. Pennsylvania's SAT composite score ranked low on the national scale in 2004. The composite SAT score of 1,003 left Pennsylvania ranking 44 out of the 50 states and Washington, DC.[87]
AP Courses
In 2014, Richland High School offered 3 Advanced Placement (AP) courses at a higher cost than regular courses. The fee for each AP Exam was $91 (2014).[88] The school retains $9 of that fee as a rebate to help with administrative costs. In 2012, the fee was $89 per test per pupil. Students have the option of taking College Board approved courses and then taking the College Board's examination in the Spring. Students, who achieve a 3 or better on the exam, may be awarded college credits at US universities and colleges. Each higher education institution sets its own standards about what level of credits are awarded to a student based on their AP exam score. Most higher education give credits for scores of 4 or 5. Some schools also give credits for scores of 3. High schools give credits towards graduation to students who take the school's AP class. At Richland High School 24.8% of the students who took an AP course earned a 3 or better on the exam.[89]
Junior high school
Seventh grades have been tested in reading and mathematics since 2006, under the federal mandates of NCLB. Eighth graders are tested in: reading, writing, mathematics and science. Beginning in the Spring of 2013, eighth graders, who are enrolled in Algebra I, take the Keystone Exam for Algebra I at the end of the course. The testing of 8th grade in reading and mathematics began in 1999, as a state initiative.[90] Testing in science began in 2007. The goal is for 100% of students to be on grade level or better in reading and mathematics, by the Spring of 2014. The tests focus on the state's Academic Standards for reading, writing, mathematics and science.[91] The standards were published in 1998 and are mandated by the Pennsylvania State Board of Education.[54] In 2014, the Commonwealth of Pennsylvania adopted the Pennsylvania Core Standards - Mathematics.[92]
- PSSA Results
|
8th Grade Reading
|
8th Grade Math:
|
8th Grade Science:
- 2012 - 82% on grade level (7% below basic). State - 59%[99]
- 2011 - 77% (10% below basic). State – 58.3%
- 2010 - 76% (9% below basic). State - 57%[100]
- 2009 - 70% (6% below basic). State - 55%[101]
- 2008 - 63%, State - 52%[102]
|
7th Grade Reading
|
7th Grade Math:
|
Elementary School
Richland Elementary School is located at 321 Schoolhouse Road. In 2014, the Richland Elementary School enrollment was 844 pupils in grades kindergarten through 6th, with 30% of pupils receiving a federal free or reduced-price meals due to family poverty. Additionally, 10% of the pupils receive special education services, while 2% are identified as gifted.[103] According to a report by the Pennsylvania Department of Education, 76% of the teachers were rated highly qualified under No Child Left Behind. The school provides full-day kindergarten since 2012.[104] The school is a federally designated Title I school.
According to the National Center for Education Statistics, in 2012, enrollment was 829 pupils in grades kindergarten through 6th, with 154 pupils receiving a free or reduced-price lunch. The school employed 46 teachers, yielding a student-teacher ratio of 18:1.[105] According to a report by the Pennsylvania Department of Education, 100% of its teachers were rated "Highly Qualified" under the federal No Child Left Behind Act.[106] The school provided full-day kindergarten to all its pupils.[107]
- 2014 School Performance Profile
Richland Elementary School achieved a score of 90 out of 100. The score reflects on grade level: reading, science, writing and mathematics achievement. In 2013–2014, only 72% of the students were reading on grade level in grades 3rd through 6th. In 3rd grade, 70% of the pupils were reading on grade level. In math, 82% were on grade level (3rd-6th grades). In 4th grade science, 93% of the pupils demonstrated on grade level understanding. In writing, only 75% of 5th grade pupils demonstrated on grade level skills.[108]
AYP History
Richland Elementary School achieved Adequate Yearly Progress (AYP) status each school year 2003 through 2012.[109] Attendance rate was 95% in 2011 and 96% in 2010.[110]
- PSSA History
Each year, in the Spring, in order to comply with the federal No Child Left Behind Law, 3rd graders and sixth graders take the PSSAs in math and reading. The fourth grade is tested in reading, math and science. The fifth grade is evaluated in reading, mathematics and writing. Pennsylvania System of School Assessments, commonly called PSSAs are No Child Left Behind Act related examinations which were administered beginning 2003 to all Pennsylvania public school students in grades 3rd-8th.[111] The goal was for 100% of students to be on grade level or better in reading and mathematics, by the Spring of 2014.[112][113][114] The tests focused on the state's Academic Standards for reading, writing, mathematics and science. The Science exam is given to 4th grades and includes content in science, technology, ecology and the environmental studies.[115] The first cohort of children who attended Accountability Block Grant funded full-day kindergarten reached third grade and took the PSSAs in the spring of 2008.
|
6th Grade Reading:
|
6th Grade Math:
|
|
5th Grade Reading:
|
5th Grade Math:
|
|
|
- 4th Grade Science
- 2012 - 85%, (2% below basic). State - 82%
- 2011 - 89%, (3% below basic), State – 82.9%
- 2010 - 89%, (4% below basic), State - 81%
- 2009 - 95%, (0% below basic), State - 83%
- 2008 - 97%, (0% below basic), State - 81%
|
|
Special education
In December 2013, Richland School District administration reported that 164 pupils, or 10% of the district's pupils, received special education services, with 38% of the identified students having a specific learning disability.[121] In December 2010, the district administration reported that 160 pupils, or 10% of the district's pupils, received special education services.[122]
In order to comply with state and federal Individuals with Disabilities Education Act rules and regulations, the school district engages in identification procedures to ensure that eligible students receive an appropriate educational program consisting of special education and related services, individualized to meet student needs. At no cost to the parents, these services are provided in compliance with state and federal law; and are reasonably calculated to yield meaningful educational benefit and student progress.[123] To identify students who may be eligible for special education services, various screening activities are conducted on an ongoing basis. These screening activities include: review of group-based data (cumulative records, enrollment records, health records, report cards, ability and achievement test scores); hearing, vision, motor, and speech/language screening; and review by the Special Education administration. When screening results suggest that the student may be eligible, the district seeks parental consent to conduct a multidisciplinary evaluation. Parents who suspect their child is eligible may verbally request a multidisciplinary evaluation from a professional employee of the district or contact the district's Special Education Department.[124]
In 2010, the state of Pennsylvania provided $1,026,815,000 for special education services. The funds were distributed to districts based on a state policy which estimates that 16% of the district's pupils are receiving special education services. This funding is in addition to the state's basic education per pupil funding, as well as, all other state and federal funding.[125] The Pennsylvania Special Education funding system assumes that 16% of the district's students receive special education services. It also assumes that each student's needs accrue the same level of costs.[126] The state requires each district to have a three-year special education plan to meet the unique needs of its special education students.[127] Overidentification of students in order to increase state funding has been an issue in the Commonwealth. Some districts have more than 20% of its students receiving special education services while others have 10% supported through special education services.[128] The IDEA 2004 requires each school entity to publish a notice to parents, in newspapers or other media, including the student handbook and website regarding the availability of screening and intervention services and how to access them.
Students who have an Individual Education Plan (IEP) may take the PSSA-M an alternative math exam rather than the PSSA.[129] Some special education students may take the PASA (Pennsylvania Alternate System of Assessment), rather than the PSSAs.[130] Schools are permitted to provide accommodations to some students.[131] In 2012, the Obama Administration's US Department of Education issued a directive requiring schools include students with disabilities in extracurricular activities, including sports.[132]
Richland School District received a $$731,871 supplement for special education services in 2010.[133] For the 2011–2012, 2012–2013 and 2013–2014 school years, all Pennsylvania public school districts received the same level of funding for special education that they received in 2010. This level funding was provided regardless of changes in the number of pupils who need special education services and regardless of the level of services the respective students required.[134] For the 2014–2015 school year, ASD received an increase to $737,754 from the Commonwealth for special education funding.[135] Additionally, the state provides supplemental funding for extraordinarily impacted students. The district must apply for this added funding.
In 2013, the state's Special Education Funding Reform Commission provided a report on the state of funding for special education in the Commonwealth.[136] Funding for special education programs is borne largely on a local basis at 60%, with the state contributing $1 billion or 30% and the federal government providing 10% of the funding.
Gifted education
The district administration reported that 25 or 1.55% of its students were gifted in 2009.[137] By law, the district must provide mentally gifted programs at all grade levels. The referral process for a gifted evaluation can be initiated by teachers or parents by contacting the student's building principal and requesting an evaluation. All requests must be made in writing. To be eligible for mentally gifted programs in Pennsylvania, a student must have a cognitive ability of at least 130 as measured on a standardized ability test by a certified school psychologist. Other factors that indicate giftedness will also be considered for eligibility.[138][139]
Bullying policy
In 2009, the administrative reported there was one incident of bullying in the district.[140][141]
The Richland School Board has provided the district's antibully policy online.[142] All Pennsylvania schools are required to have an anti-bullying policy incorporated into their Code of Student Conduct. The policy must identify disciplinary actions for bullying and designate a school staff person to receive complaints of bullying. The policy must be available on the school's website and posted in every classroom. All Pennsylvania public schools must provide a copy of its anti-bullying policy to the Office for Safe Schools every year, and shall review their policy every three years. Additionally, the district must conduct an annual review of that policy with students.[143] The Center for Schools and Communities works in partnership with the Pennsylvania Commission on Crime & Delinquency and the Pennsylvania Department of Education to assist schools and communities as they research, select and implement bullying prevention programs and initiatives.[144]
Education standards relating to student safety and anti-harassment programs are described in the 10.3. Safety and Injury Prevention in the Pennsylvania Academic Standards for Health, Safety and Physical Education.[145]
Budget
Pennsylvania public school districts budget and expend funds according to procedures mandated by the General Assembly and the Pennsylvania Department of Education (PDE). An annual operating budget is prepared by school district administrative officials. A uniform form is furnished by the PDE and submitted to the board of school directors for approval prior to the beginning of each fiscal year on July 1.
Under Pennsylvania's Taxpayer Relief Act, Act 1 of the Special Session of 2006, all school districts of the first class A, second class, third class and fourth class must adopt a preliminary budget proposal. The proposal must include estimated revenues and expenditures and the proposed tax rates. This proposed budget must be considered by the board no later than 90 days prior to the date of the election immediately preceding the fiscal year. The preliminary budget proposal must also be printed and made available for public inspection at least 20 days prior to its adoption. The board of school directors may hold a public hearing on the budget, but are not required to do so. The board must give at least 10 days’ public notice of its intent to adopt the final budget according to Act 1 of 2006.[146]
In 2013, the average teacher salary in Richland School District was $59,242 a year. The district employed 115 teachers and administrators.[147] Richland School District teacher and administrator retirement benefits are equal to at least 2.00% x Final Average Salary x Total Credited Service. (Some teachers benefits utilize a 2.50% benefit factor.)[148] After 40 years of service, a teacher can retire with 100% of the average salary of their final 3 years of employment. According to a study conducted at the American Enterprise Institute, in 2011, public school teachers’ total compensation is roughly 50 percent higher than they would likely receive in the private sector. The study found that the most generous benefits that teachers receive are not accounted for in many studies of compensation including: pension, retiree health benefits and job security.[149]
Administration costs Richland School District administrative costs per pupil in 2008 was $643 per pupil. The lowest administrative cost per pupil in Pennsylvania was $398 per pupil.[150] The Pennsylvania School Boards Association keeps statistics on salaries of public school district employees in Pennsylvania. According to the association's report, the average salary for a superintendent for the 2007–2008 school year was $122,165. Superintendents and administrators receive a benefit package commensurate with that offered to the district's teachers' union.[151]
Per-pupil spending In 2008, the Richland School District administration reported that per-pupil spending was $13,259 which ranked 395th among Pennsylvania's 501 school districts. In 2010, the Richland School District's per-pupil spending was $12,075.20.[152] In 2013, the per-pupil spending was reported as $11,887.39.[153] In 2011, Pennsylvania's per-pupil spending was $13,467, ranking 6th in the United States.[154] In 2007, the Pennsylvania per pupil total expenditures was reported as $12,759.[155]
The U.S. Census Bureau reported that Pennsylvania spent $8,191 per pupil in school year 2000–2001.[156] In 2007, the Pennsylvania per pupil total expenditures was reported as $12,759.[155] Among the fifty states, Pennsylvania's total per pupil revenue (including all sources) ranked 11th at $15,023 per student, in 2008–2009.[157] Pennsylvania's total revenue per pupil rose to $16,186 ranking 9th in the nation in 2011.[158]
Audit In September 2010, the Pennsylvania Auditor General conducted a performance audit of the district. The findings were reported to the administration and the school board by state officials.[159]
Tuition Students who live in the district's attendance area may choose to attend one of Pennsylvania's 157 public charter schools. A student living in a neighboring public school district or a foreign exchange student may seek admission to Richland School District. For these cases, the Pennsylvania Department of Education sets an annual tuition rate for each school district. It is the amount the public school district pays to a charter school for each resident student that attends the charter and it is the amount a nonresident student's parents must pay to attend the Richland School District schools. The 2013 tuition rates are Elementary School - $6,957.32, High School - $7,874.98.[160]
Richland School District is funded by a combination of: a local earned income tax 0.5%; a local services tax - $5 per annum; a per capita tax - $5 per annum; a property tax; a real estate transfer tax 0.5%; a mercantile tax - 0.08%; coupled with substantial funding from the Commonwealth of Pennsylvania and the federal government. Grants can provide an opportunity to supplement school funding without raising local taxes. In the Commonwealth of Pennsylvania, pension income and Social Security income are exempted from state personal income tax and local earned income tax regardless of the individual's wealth.[161] The average Pennsylvania public school teacher pension in 2011 exceeds $60,000 a year, plus they receive federal Social Security benefits: both are free of Pennsylvania state income tax and local income tax which funds local public schools.[162]
State basic education funding
According to a report from Representative Todd Stephens office, Richland School District receives 27.2% of its annual revenue from the state.[163][164]
For the 2014–2015 school year, Richland School District received $3,036,349 in State Basic Education funding. The district received $66,386 in new Ready To Learn Block grant. The State's enacted Education Budget includes $5,526,129,000 for the 2014–2015 Basic Education Funding.[165] The Pennsylvania Education budget also includes Accountability Block Grant funding at $100 million and $241 million in new Ready to Learn funding for public schools that focus on student achievement and academic success. The State is paying $500.8 million to Social Security on the school employees behalf and another $1.16 billion to the state teachers pension system (PSERS). In total, Pennsylvania's Education budget for K-12 public schools is $10 billion. This was a $305 million increase over 2013–2014 state spending and the greatest amount ever allotted by the Commonwealth for its public schools.[166]
In the 2013–2014 school year, Richland School District received a 2.5% increase or $3,038,213 in Pennsylvania Basic Education Funding. This is $72,911 more than its 2012–2013 state BEF to the district. Additionally, Richland School District received $36,379 in Accountability Block Grant funding to focus on academic achievement and level funding for special education services. Among the public school districts in Cambria County, Westmont Hilltop School District received the highest percentage increase in BEF at 2.5%. The district had the option of applying for several other state and federal grants to increase revenues. The Commonwealth's budget increased Basic Education Funding statewide by $123 million to over $5.5 billion. Most of Pennsylvania's 500 public school districts received an increase of Basic Education Funding in a range of 0.9% to 4%. Eight public school districts received exceptionally high funding increases of 10% to 16%. The highest increase in state funding was awarded to Austin Area School District which received a 22.5% increase in Basic Education Funding.[167] The highest percent of state spending per student is in the Chester-Upland School District, where over 78 percent comes from state coffers. In Philadelphia, it is nearly 49 percent.[168] As a part of the education budget, the state provided the PSERS (Pennsylvania school employee pension fund) with $1,017,000,000 and Social Security payments for school employees of $495 million.[169]
Ready to Learn grant
Beginning in the 2014–2015 budget, the State funded a new Ready to Learn Grant for public schools. A total of $100 million is allocated through a formula to districts based on the number of students, level of poverty of community as calculated by its market value/personal income aid ratio (MV/PI AR) and the number of English language learners. Ready to Learn Block Grant funds may be used by the districts for: school safety; Ready by 3 early childhood intervention programs; individualized learning programs; and science, technology, engineering and math (STEM) programs.[170]
Richland School District received $102,765 in Ready to Learn Grant dollars in addition to State Basic Education funding, Special Education funding, reimbursement for Social Security payments for employees and other state grants which the district must apply to receive.
Other grants
The Richland School District did not participate in: Pennsylvania Department of Environmental Protection's Environmental Education annual grants;[171][172] PA Science Its Elementary grants (discontinued effective with 2009–2010 budget by Governor Rendell);[173] Education Assistance Grants; 2012 Striving Readers Comprehensive Literacy grant;[174] 2013 Safe Schools and Resource Officer grants; Project 720 High School Reform grants (discontinued effective with 2011–2012 budget); nor the federal 21st Century Learning grants.
Federal Stimulus grant
Richland School District received an extra $733,265 in ARRA - Federal stimulus money to be used in specific programs like special education and meeting the academic needs of low-income students.[175] The funding was limited to the 2009–2010 and 2010–2011 school years.[176]
Common Cents state initiative
The school board elected to not participate in the Pennsylvania Department of Education Common Cents program. The program called for the state to audit the district, at no cost to local taxpayers, to identify ways the district could save tax dollars.[177] After the review of the information, the district was not required to implement the recommended cost savings changes.
Real estate taxes
Property tax rates in 2015–2016 were set by the school board at 48.9500 mills. A mill is $1 of tax for every $1,000 of a property's assessed value. Irregular property reassessments have become a serious issue in the commonwealth as it creates a significant disparity in taxation within a community and across a region.[178] Property taxes, in the Commonwealth of Pennsylvania, apply only to real estate - land and buildings. The property tax is not levied on cars, business inventory, or other personal property. Certain types of property are exempt from property taxes, including: places of worship, places of burial, private social clubs, charitable and educational institutions and government property. Additionally, service-related, disabled US military veterans may seek an exemption from paying property taxes. Pennsylvania school district revenues are dominated by two main sources: 1) Property tax collections, which account for the vast majority (between 75-85%) of local revenues; and 2) Act 511 tax collections, which are around 15% of revenues for school districts.[179] When a Pennsylvania public school district includes municipalities in two counties, each of which has different rates of property tax assessment, a state board equalizes the tax rates between the counties.[180] In 2010, miscalculations by the State Tax Equalization Board (STEB) were widespread in the Commonwealth and adversely impacted funding for many school districts, including those that did not cross county borders.[181]
|
|
The average yearly property tax paid by Cambria County residents amounts to about 2.4% of their yearly income. Cambria County ranked 1048th out of the 3143 United States counties for property taxes as a percentage of median income.[192] According to a report prepared by the Pennsylvania Department of Education, the total real estate taxes collected by all school districts in Pennsylvania rose from $6,474,133,936 in 1999–1900 to $10,438,463,356 in 2008–2009 and to $11,153,412,490 in 2011.[193] Property taxes in Pennsylvania are relatively high on a national scale. According to the Tax Foundation, Pennsylvania ranked 11th in the U.S. in 2008 in terms of property taxes paid as a percentage of home value (1.34%) and 12th in the country in terms of property taxes as a percentage of income (3.55%).[194] Pennsylvania's 2011 tax burden of 10.35% ranked 10th highest out of 50 states. The tax burden was above the national average of 9.8%. Pennsylvania's taxpayers paid $4,374 per capita in state and local taxes, including school taxes.[195]
Act 1 Adjusted Index
The Act 1 of 2006 Index regulates the rates at which each school district can raise property taxes in Pennsylvania. Districts are not allowed to raise taxes above that index unless they allow voters to vote by referendum, or they seek an exception from the state Department of Education. The base index for the 2011–2012 school year is 1.4 percent, but the Act 1 Index can be adjusted higher, depending on a number of factors, such as property values and the personal income of district residents. Act 1 included 10 exceptions, including: increasing pension costs, increases in special education costs, a catastrophe like a fire or flood, increase in health insurance costs for contracts in effect in 2006 or dwindling tax bases. The base index is the average of the percentage increase in the statewide average weekly wage, as determined by the PA Department of Labor and Industry, for the preceding calendar year and the percentage increase in the Employment Cost Index for Elementary and Secondary Schools, as determined by the Bureau of Labor Statistics in the U.S. Department of Labor, for the previous 12-month period ending June 30. For a school district with a market value/personal income aid ratio (MV/PI AR) greater than 0.4000, its index equals the base index multiplied by the sum of .75 and its MV/PI AR for the current year.[196] In June 2011, the Pennsylvania General Assembly eliminated six of the ten the exceptions to the Index.[197] The following exceptions were maintained: 1) costs to pay interest and principal on indebtedness incurred prior to September 4, 2004 for Act 72 schools and prior to June 27, 2006 for non-Act 72 schools; 2) costs to pay interest and principal on electoral debt; 3) costs incurred in providing special education programs and services (beyond what is already paid by the State); and 4) costs due to increases of more than the index in the school's share of payments to PSERS taking into account on the PSERS contribution rate.[198]
The Richland School District Adjusted Index for 2006–2007 through 2011–2012.[199]
|
|
For the 2017–2018 budget year, Richland School Board did not apply for exceptions to exceed their Act 1 Index limit and has not applied for the Act 1 Index or raised real estate taxes since the 2007–2008 school year. This increase was only done to support the construction of the new Richland High School that consolidated the former Richland High School and Richland Middle School due to an emergency closing of the former Richland Middle School due to a roof collapse when the building was not occupied.
In 2014–2015, all Pennsylvania school districts were required to make a 21.4% of payroll payment to the teacher's pension fund (PSERS).[204] For the school budget 2014–2015, 316 Pennsylvania public school districts adopted a resolution certifying that tax rates would not be increased above its Act 1 Index limit. Another 181 school districts adopted a preliminary budget leaving open the option of exceeding the Index limit. Districts may apply for multiple exceptions each year. For the pension costs exception, 163 school districts received approval to exceed the Index in full, while others received a partial approval of their request. For special education costs, 104 districts received approval to exceed their tax limit. Seven Pennsylvania public school districts received an approval for the grandfathered construction debts exception.[205]
Property tax relief
In 2010, the Homestead/Farmstead Property Tax Relief from gambling for the Richland School District was $62 per approved permanent primary residence. In the district, 3,730 property owners applied for the tax relief.[206] The relief was subtracted from the total annual school property tax bill. Property owners apply for the relief through the county Treasurer's office. Farmers can qualify for a farmstead exemption on building used for agricultural purposes. The farm must be at least 10 contiguous acres (40,000 m2) and must be the primary residence of the owner. Farmers can qualify for both the homestead exemption and the farmstead exemption. In Cambria County, 54.33% of eligible property owners applied for property tax relief in 2009.[207] In Cambria County, the highest amount of tax relief in 2010, went to approved property owners in Ferndale Area School District who got a $214 property tax cut. The highest property tax relief in Pennsylvania went to the residents of Chester Upland School District of Delaware County who received $632 per approved homestead.[208] This was the third year they were the top recipient.
Additionally, the Pennsylvania Property Tax/Rent Rebate program is provided for low income Pennsylvanians aged 65 and older; widows and widowers aged 50 and older; and people with disabilities age 18 and older. The income limit is $35,000 for homeowners. The maximum rebate for both homeowners and renters is $650. Applicants can exclude one-half (1/2) of their Social Security income, consequently, individual with income much more than $35,000 may still qualify for a rebate. Individuals must apply annually for the rebate. This can be taken in addition to Homestead/Farmstead Property Tax Relief.[209]
Property taxes in Pennsylvania are relatively high on a national scale. According to the Tax Foundation, Pennsylvania ranked 11th in the U.S. in 2008 in terms of property taxes paid as a percentage of home value (1.34%) and 12th in the country in terms of property taxes as a percentage of income (3.55%).[210]
Wellness policy
Richland School Board established a district wellness policy in 2006.[211] The policy deals with nutritious meals served at school, the control of access to some foods and beverages during school hours, age appropriate nutrition education for all students, and physical education for students K-12. The policy is in response to state mandates and federal legislation (P.L. 108 – 265). The law dictates that each school district participating in a program authorized by the Richard B. Russell National School Lunch Act (42 U.S.C. 1751 et seq) or the Child Nutrition Act of 1966 (42 U.S.C. 1771 et seq) "shall establish a local school wellness policy by School Year 2006." Most districts identified the superintendent and school foodservice director as responsible for ensuring local wellness policy implementation.[212]
The legislation placed the responsibility of developing a wellness policy at the local level so the individual needs of each district can be addressed. According to the requirements for the Local Wellness Policy, school districts must set goals for nutrition education, physical activity, campus food provision, and other school-based activities designed to promote student wellness. Additionally, districts were required to involve a broad group of individuals in policy development and to have a plan for measuring policy implementation. Districts were offered a choice of levels of implementation for limiting or prohibiting low nutrition foods on the school campus. In final implementation these regulations prohibit some foods and beverages on the school campus.[213] The Pennsylvania Department of Education required the district to submit a copy of the policy for approval.
The district offers both a free or reduced-price lunch to children in low income families. All students attending the school can eat breakfast and lunch. Children from families with incomes at or below 130 percent of the federal poverty level are provided a breakfast and lunch at no cost to the family. Children from families with incomes between 130 and 185 percent of the federal poverty level can be charged no more than 30 cents per breakfast. A foster child whose care and placement is the responsibility of the State or who is placed by a court with a caretaker household is eligible for both a free breakfast and a free lunch. Runaway, homeless and Migrant Youth are also automatically eligible for free meals.[214] The meals are partially funded with federal dollars through the United States Department of Agriculture.[215]
In 2013, the USDA issued new restrictions to foods in public schools. The rules apply to foods and beverages sold on all public school district campuses during the day. They limit vending machine snacks to a maximum of 200 calories per item. Additionally, all snack foods sold at school must meet competitive nutrient standards, meaning they must have fruits, vegetables, dairy or protein in them or contain at least 10 percent of the daily value of fiber, calcium, potassium, and Vitamin D.[216] In order to comply with the Healthy, Hunger-Free Kids Act of 2010 all US public school districts are required to raise the price of their school lunches to $2.60 regardless of the actual cost of providing the lunch.[217] The Healthy Hunger-Free Kids Act of 2010 mandates that districts raise their full pay lunch prices every year until the price of non-subsidized lunches equals the amount the federal government reimburses schools for free meals. That subsidy in 2013–2014 was $2.93.
In 2014, President Obama ordered a prohibition of advertisements for unhealthy foods on public school campuses during the school day.[218] The Food and Drug Administration requires that students take milk as their beverage at lunch. In accordance with this law, any student requesting water in place of milk with their lunch must present a written request, signed by a doctor, documenting the need for water instead of milk.[219][220]
Richland School District provides health services as mandated by the Commonwealth and the federal government. Nurses are available in each building to conduct annual health screenings (data reported to the PDE and state Department of Health) and to dispense prescribed medications to students during the school day. Students can be excluded from school unless they comply with all the State Department of Health's extensive immunization mandates. School nurses monitor each pupil for this compliance.[221][222] Nurses also monitor each child's weight.[223]
Extracurriculars
The Richland School District offers a wide variety of clubs, activities and an extensive sports. In 2014, the district reports spending over $806,000 for student activities. Eligibility for participation is determined by school board policy and in compliance with standards set by the Pennsylvania Interscholastic Athletic Association (PIAA). The district is compliant with state law posting its Interscholastic Athletic Opportunities Disclosure Form on its website.[224] Article XVI-C of the Public School Code requires the disclosure of interscholastic athletic opportunities for all public secondary school entities in Pennsylvania. All school entities with grades 7-12 are required to annually collect data concerning team and financial information for all male and female athletes beginning with the 2012–2013 school year and submit the information to the Pennsylvania Department of Education. Beginning with the 2013–2014 school year, all non-school (booster club and alumni) contributions and purchases must also be reported to PDE.[225]
By Pennsylvania law, all K-12 students in the district, including those who attend a private nonpublic school, cyber charter school, charter school and those home-schooled, are eligible to participate in the extracurricular programs, including all athletics. They must meet the same eligibility rules as the students enrolled in the district's schools.[226]
According to PA Child Abuse Recognition and Reporting Act 126 of 2014, all volunteer coaches and all those who assist in student activities, must have criminal background checks. Like all school district employees, they must also attend an anti child abuse training once every three years.[227][228][229]
According to Pennsylvania's Safety in Youth Sports Act, all sports coaches, paid and volunteer, are required to annually complete the Concussion Management Certification Training and present the certification before coaching.[230][231]
Sports
Coaches receive compensation as outlined in the teachers' union contract. When athletic competition exceeds the regular season, additional compensation is paid.[232]
- Varsity
|
|
- Junior High School Sports
|
|
According to PIAA directory July 2015[233]
External links
References
- Pennsylvania Department of Education, Common Core of Data Richland School District 2012, 2015
- Pennsylvania Department of Education (November 4, 2015). "Richland School District District Fast Facts".
- Pennsylvania Department of Education, Enrollment and Projections report, July 2012
- Pennsylvania Department of Education, Enrollment and Projections report, July 20, 2010
- Pennsylvania Department of Education (2014). "Public School Enrollment Reports".
- Arnold J Nadonley, Superintendent (June 30, 2015). "Richland School District Budget report to the PDE" (PDF).
- David Hurst (May 13, 2013). "Richland tentatively OKs budget with no tax hike". The Tribune Democrat.
- US Census Bureau, 2010 Census Poverty Data by Local Education Agency, 2011
- proximityone (2014). "School District Comparative Analysis Profiles".
- Pennsylvania Budget and Policy Center, Education Facts Student Poverty Concentration by LEA, 2012
- US Census Bureau, American Fact Finder 2009, 2009
- US Census Bureau (2010). "American Fact Finder, State and County quick facts".
- US Census Bureau (September 2011). "Income, Poverty, and Health Insurance Coverage in the United States: 2010" (PDF).
- US Census Bureau (2014). "Pennsylvania Median household income, 2006-2010 by County".
- Michael Sauter & Alexander E.M. Hess (August 31, 2013). "America's most popular six-figure jobs". USA Today.
- Jeff Guo (September 15, 2015). "Lower wages for whites, higher wages for immigrants, and inequality for all". The Washington Post.
- Pennsylvania Public School Code Governance 2010
- Pennsylvania General Assembly, Pennsylvania School Code, 2013
- Pittsburgh Business Times (April 10, 2015). "Guide to Pennsylvania Schools Statewide School District Ranking 2015".
- Pittsburgh Business Times (April 11, 2014). "What makes up a district's School Performance Profile score?".
- Pittsburgh Business Times (April 11, 2014). "Western Pennsylvania School Guide 2014".
- "Statewide Honor Roll Rankings 2013". Pittsburgh Business Times. April 5, 2013.
- Pittsburgh Business Times, Statewide Honor Roll Rankings 2012, April 4, 2012
- Pittsburgh Business Times (April 4, 2011). "Statewide Honor Roll Rankings information 2011". Archived from the original on January 19, 2012.
- Pittsburgh Business Times (April 30, 2010). "Statewide Honor Roll Rankings 2010".
- "Three of top school districts in state hail from Allegheny County". Pittsburgh Business Times. May 23, 2007. Archived from the original on July 18, 2011.
- "2009 PSSA RESULTS Richland School District". 2009.
- Pennsylvania Department of Education (September 21, 2012). "Richland School District AYP Overview 2012".
- Pennsylvania Department of Education (September 21, 2012). "About Adequate Yearly Progress (AYP) in Pennsylvania". Archived from the original on October 12, 2014.
- Pennsylvania Department of Education, Pennsylvania Public School District AYP History, 2011
- Pennsylvania Department of Education, Pennsylvania District AYP History 2003-2010, 2011
- PDE, Graduation rate by LEA, 2014
- PDE, Graduation rate by LEA, 2013
- Pennsylvania Department of Education (September 29, 2011). "Richland School District AYP Data Table". Archived from the original on September 25, 2015.
- Pennsylvania Department of Education (March 15, 2011). "New 4-year Cohort Graduation Rate Calculation Now Being Implemented".
- Pennsylvania Department of Education (2010). "Richland School District Academic Achievement Report Card Data table". Archived from the original on 2015-09-25.
- Pennsylvania Partnerships for Children (2008). "High School Graduation rate 2007" (PDF).
- Pennsylvania Department of Education (December 4, 2014). "Richland High School Fast Facts 2014".
- US News & World Report (2015). "Best High Schools".
- National Center for Education Statistics, Common Core Data - Richland High School, 2013
- Pennsylvania Department of Education, Professional Qualifications of Teachers Richland High School 2012, September 21, 2012
- Pennsylvania Department of Education (November 6, 2014). "Richland High School Academic Performance Data 2014".
- Evamarie Socha (November 6, 2014). "Half of Valley districts see state test scores decline". The Daily Item.
- Eleanor Chute (November 21, 2014). "Pennsylvania student scores declined with reduced funding, test results show". Pittsburgh Post-Gazette.
- Acting Secretary of Education Carolyn Dumaresq, Acting Secretary of Education Announces Results of 2013-14 School Performance Profile; Strong Performance in 72 Percent of Schools, November 6, 2014
- Kathy Boccella; Dylan Purcell & Kristen A. Graham (November 6, 2014). "Pa. school rankings: Downingtown STEM No. 1; Phila. falters". The Philadelphia Inquirer.
- Jan Murphy (November 6, 2014). "More Pa. school scores decline than improve, state report card shows". Pennlive.com.
- Pennsylvania Department of Education, Richland High School Academic Performance Data 2013, October 4, 2013
- Eleanor Chute & Mary Niederberger (December 11, 2013). "New assessment shows fuller picture of Pa. schools". Pittsburgh Post-Gazette.
- Pennsylvania Department of Education (November 4, 2014). "Richland High School AYP Overview 2012". Archived from the original on September 25, 2015.
- Pennsylvania Department of Education, Richland Junior Senior High School Academic Report Card 2011, September 29, 2011
- PDE, AYP status by LEA 2003-2011, 2012
- L.R. Kimball (2008). "Richland High School blends sustainable design principles with state-of-the-art educational resources" (PDF).
- Pennsylvania Department of Education (2014). "State Academic Standards".
- Pennsylvania Department of Education (2014). "State Assessment System".
- Pennsylvania Department of Education (September 29, 2012). "2011-2012 PSSA and AYP Results".
- Pennsylvania Department of Education (September 29, 2011). "2010-2011 PSSA and AYP Results".
- Pennsylvania Department of Education (2010). "2009-2010 PSSA and AYP Results".
- The Times-Tribune. (September 2009). "Grading Our Schools database, 2009 PSSA results".
- Pennsylvania Department of Education (August 15, 2008). "2007-2008 PSSA and AYP Results".
- Pennsylvania Department of Education (2007). "PSSA Math and Reading results".
- "How is your school doing?". Pittsburgh Post-Gazette. October 15, 2012.
- Pennsylvania Department of Education, Richland Junior-Senior High School Academic Achievement Report Card 2011, September 29, 2011
- Pennsylvania Department of Education (September 21, 2012). "Richland High School Academic Achievement Report Card 2012" (PDF). Archived from the original (PDF) on September 25, 2015.
- Pennsylvania Department of Education (September 29, 2011). "2010-2011 PSSA results in Science".
- The Times-Tribune (2009). "Grading Our Schools database, 2009 Science PSSA results".
- Pennsylvania Department of Education (January 20, 2009). "Pennsylvania College Remediation Report". Archived from the original on May 3, 2012.
- National Center for Education Statistics, IPEDS Integrated Postsecondary Education Data System, 2008
- Richland School Board and Administration (August 27, 2008). "Richland School District Strategic Plan - Assessment and Academics Chapter 3" (PDF).
- Richland High School Administration (2014). "Student Handbook 2014-15" (PDF). Archived from the original (PDF) on 2015-09-25.
- Pennsylvania State Board of Education (1997). "Pennsylvania Code §4.24 (a) High school graduation requirements".
- Pennsylvania State Board of Education, Proposed changes to Chapter 4, May 10, 2012
- Pennsylvania Department of Education (2010). "Keystone Exam Overview" (PDF).
- Megan Harris (September 12, 2013). "Pennsylvania changing high school graduation requirements". Tribune Live.
- Pennsylvania Department of Education (September 2011). "Pennsylvania Keystone Exams Overview". Archived from the original on March 17, 2012.
- Pennsylvania State Board of Education (2010). "Rules and Regulation Title 22 PA School Code CH. 4".
- Pennsylvania Department of Education, State Board of Education Finalizes Adoption of Pennsylvania Common Core State Academic Standards and High School Graduation Requirements, March 14, 2013
- Pennsylvania Department of Education (2011). "Keystone Exams".
- Challenge Program Administration (2015). "The Challenge Program Sponsored Schools 2015".
- PDE, School Performance profile, November 6, 2014
- Pennsylvania Department of Education (2014). "SAT and ACT Scores".
- College Board (2014). "2014 College-Bound Seniors State Profile Report" (PDF).
- College Board (2013). "The 2013 SAT Report on College & Career Readiness".
- Pennsylvania Department of Education (2011). "Public School SAT Scores 2011". Archived from the original on 2011-10-15.
- College Board (September 15, 2011). "SAT Scores State By State - Pennsylvania".
- "While U.S. SAT scores dip across the board, N.J. test-takers hold steady". NJ.com. September 15, 2011.
- The Center for Rural Pennsylvania (August 2006). "SAT Scores and Other School Data".
- College Board (2014). "Exam Fees and Reductions: 2015".
- PDE, School Performance Profile - Academic Performance Data - Richland High School, December 2014
- Pennsylvania Department of Education. "IU16-PSSA 95-96 Results by School". Retrieved May 11, 2014.
- Pennsylvania Department of Education (2014). "Standards Aligned Systems".
- Pennsylvania Department of Education (2014). "State Academic Standards Mathematics".
- Pennsylvania Department of Education, Richland High School Academic Achievement Report Card 2009, September 14, 2009
- Pennsylvania Department of Education (August 2008). "Reading and Math PSSA 2008 by Schools".
- Pennsylvania Department of Education, Richland High School Academic Achievement Report Card 2011, September 29, 2011
- Pennsylvania Department of Education, Richland High School Academic Achievement Report Card 2010, October 20, 2010
- Pennsylvania Department of Education. "2009 PSSAs: Reading, Math, Writing and Science Results".
- Pennsylvania Department of Education, Richland High School Academic Achievement Report Card 2008, August 15, 2008
- The Times-Tribune (2012). "Grading Our Schools database, 2011-12 Science PSSA results".
- Pennsylvania Department of Education Report (August 2010). "Science PSSA 2010 by Schools".
- Pennsylvania Department of Education Report (August 2009). "Science PSSA 2009 by Schools".
- Pennsylvania Department of Education Report (August 15, 2008). "Science PSSA 2008 by Schools".
- Pennsylvania Department of Education (November 6, 2014). "Richland Elementary School Fast Facts 2014".
- Pennsylvania Department of Education, School Performance Profile, Richland Elementary School Fast Facts, 2014
- National Center for Education Statistics, Common Core Data – Richland Elementary School, 2013
- Pennsylvania Department of Education, Professional Qualifications of Teachers Richland Elementary School, September 21, 2012
- Pennsylvania Partnership for Children, Full-Day Kindergarten Enrollment, 2010
- Pennsylvania Department of Education (November 6, 2014). "Richland Elementary School Academic Performance Data 2014".
- Pennsylvania Department of Education (September 21, 2012). "RICHLAND ELEM School AYP Overview 2012".
- Pennsylvania Department of Education (September 29, 2011). "RICHLAND ELEM School AYP DataTable".
- Pennsylvania State Board of Education (2003). "PSSA results 2003".
- New America Foundation (2003). "No Child Left Behind Overview".
- The Goals of No Child Left Behind (July 20, 2010). "The Goals of No Child Left Behind".
- Learning Point Associates (2002). "Understanding the No Child Left Behind Act" (PDF).
- Pennsylvania State Board of Education (January 11, 2003). "Pennsylvania Academic Standards Science and Technology, Ecology and Environment". Archived from the original on November 27, 2015.
- Pennsylvania Department of Education (September 21, 2012). "Richland Elementary School Academic Achievement Report Card 2012" (PDF).
- Pennsylvania Department of Education, Richland Elementary School Academic Achievement Report Card 2011, September 29, 2011
- Pennsylvania Department of Education, Richland Elementary School Academic Achievement Report Card 2010, October 20, 2010
- Pennsylvania Department of Education, Richland Elementary School Academic Achievement Report Card 2009, September 14, 2009
- Pennsylvania Department of Education, Richland Elementary School Academic Achievement Report Card 2008, August 15, 2008
- Pennsylvania Bureau of Special Education Services (2013). "Richland School District Special Education Data Report LEA Performance on State Performance Plan (SPP) Targets". Archived from the original on 2011-08-24.
- Pennsylvania Bureau of Special Education Services (2010). "Richland School District Special Education Data Report LEA Performance on State Performance Plan (SPP) Targets". Archived from the original on 2011-08-24.
- Pennsylvania Bureau of Special Education (2008). "Pennsylvania Parent Guide to Special Education Services".
- Richland School District Special Education Administration (2011). "Richland School District Special Education Information".
- Pennsylvania Department of Education. "Pennsylvania Special Education Funding".
- Senator Patrick Browne (November 1, 2011). "Senate Education Committee Holds Hearing on Special Education Funding & Accountability". Archived from the original on July 23, 2012.
- Pennsylvania Department of Education Amy Morton, Executive Deputy Secretary (November 11, 2011). "Public Hearing: Special Education Funding & Accountability Testimony". Archived from the original on April 22, 2012.
- Baruch Kintisch Education Law Center (November 11, 2011). "Public Hearing: Special Education Funding & Accountability Testimony" (PDF). Archived from the original (PDF) on April 22, 2012.
- Eleanor Chute., Modified PSSA test in math offered for 1st time, Pittsburgh Post-Gazette, April 18, 2010
- "PSSA and Keystone Exam Accommodation Guidelines for Students with IEPs and 504 Plans". 2015.
- Pennsylvania Department of Education (December 12, 2014). "PSSA/ Keystone Accommodations Guidelines (PDE) 2015".
- US Department of Education (January 25, 2013). "U.S. Department of Education Clarifies Schools' Obligation to Provide Equal Opportunity to Students with Disabilities to Participate in Extracurricular Athletics".
- Pennsylvania Department of Education (July 2010). "Special Education Funding from Pennsylvania State_2010-2011".
- Pennsylvania Department of Education (2011). "Special Education Funding 2011-2012 Fiscal Year".
- Pennsylvania Department of Education, Special Education funding report by LEA, July 2014
- Special Education Funding Reform Commission (December 11, 2015). "Special Education Funding Reform Commission Report" (PDF).
- Pennsylvania Department of Education (July 2010). "Gifted Students as Percentage of Total Enrollment by School District/Charter School" (PDF). Archived from the original (PDF) on 2016-03-04.
- Pennsylvania Department of Education and Pennsylvania School Board. "CHAPTER 16. Special Education For Gifted Students". Retrieved February 4, 2011.
- Pennsylvania Department of Education (March 26, 2010). "Special Education for Gifted Students Notice of Parental rights" (PDF). Archived from the original (PDF) on March 4, 2016.
- Pennsylvania Office of Safe Schools (2009). "Richland School District - School Safety Annual Report 2008 – 2009".
- Pennsylvania Office of Safe Schools (2009). "Pennsylvania Safe Schools Online Reports".
- Richland School Board (January 12, 2009). "Bullying/Cyberbullying Policy 249".
- Regular Session 2007–2008 House Bill 1067, Act 61 Section 6 page 8
- Center for Safe Schools of Pennsylvania. "Bullying Prevention advisory".
- Pennsylvania Department of Education. "Pennsylvania Academic Standards".
- Pennsylvania General Assembly, Taxpayer Relief Act, Act 1 of the Special Session of 2006, June 27, 2006
- "Richland School District Payroll report 2013". OpenPA Gov.org. 2014. Archived from the original on November 19, 2010.
- Pennsylvania School Employees Retirement System (2014). "Your PSERS Benefits & Leaving Employment".
- American Enterprise Institute (2011). "Assessing the Compensation of Public School Teachers". Archived from the original on 2013-01-03.
- Fenton, Jacob. (February 2009). "Pennsylvania School District Data: Will School Consolidation Save Money?". The Morning Call.
- Pennsylvania School Board Association (October 2009). "Public School Salaries 11th Annual". Archived from the original on October 5, 2008.
- Pennsylvania Department of Education (2010). "2009-10 Selected Data - 2009-10 Total Expenditures per ADM".
- Pennsylvania Department of Education (2014). "2012-13 Selected Data - 2012-13 Total Expenditures per ADM".
- US Census Bureau, States Ranked According to Per Pupil Public Elementary-Secondary School System Finance Amounts: Fiscal Year 2011, May 2013
- US Census Bureau (2009). "Total and current expenditures per pupil in fall enrollment in public elementary and secondary education, by function and state or jurisdiction: 2006-07".
- US Census Bureau (March 2003). "Public Education Finances 2000-01 Annual Survey of Local Government Finances" (PDF).
- United States Census Bureau (2009). "States Ranked According to Per Pupil Elementary-Secondary Public School System Finance Amounts: 2008-09" (PDF).
- US Census Bureau (May 2013). "States Ranked According to Per Pupil Public Elementary-Secondary School System Finance Amounts: Fiscal Year 2011" (PDF).
- Pennsylvania Auditor General (September 2010). "Richland School District Cambria COUNTY, PENNSYLVANIA PERFORMANCE AUDIT REPORT".
- Pennsylvania Department of Education (May 2013). "Pennsylvania Public School District Tuition Rates".
- Pennsylvania Department of Revenue (2009). "Individual Income Taxation Facts".
- John Finnerty (2013). "PA teachers pensions". CNHI Harrisburg Bureau.
- Pennsylvania Representative Todd Stephens (January 23, 2014). "LEEF Funding Chart 2014".
- JANICE BISSETT & ARNOLD HILLMAN (2006). "A Summary of the History and Financing of Education in Pennsylvania 1682- 2013" (PDF). PA Association of Rural and Small Schools. Archived from the original (PDF) on 2015-12-23.
- PDE (July 7, 2014). "Enacted Education Budget 2014-2015".
- Pennsylvania Department of Education, 2014-15 Enacted Education Budget Fast Facts, July 14, 2014
- Democrat Appropriations Committee, Report on Education funding by LEA, July 2, 2013
- Sam Wood & Brian X. McCrone (January 29, 2014). "Montgomery County lawmaker proposes using Pa. horse racing funds for education". The Philadelphia Inquirer.
- Pennsylvania Office of the Budget, 2013-14 State Budget Highlights, 2013
- Pennsylvania Department of Education (2013). "Passport for Learning Block Grant".
- Department of Environmental Protection (2014). "Environmental Education Grants".
- Pennsylvania Department of Environmental Protection (April 22, 2013). "Governor Corbett Awards 92 Grants for Environmental Education and Stewardship".
- Pennsylvania Department of Education, Science: It’s Elementary Grantees Students in 143 Schools Benefit from Intensive Science Curriculum, July 22, 2008
- Pennsylvania Department of Education (May 23, 2012). "Pennsylvania Awards $36.1 Million to Strengthen Literacy Programs".
- Commonwealth of Pennsylvania (2009). "County ARRA FUNDING Report". Archived from the original on March 7, 2011.
- "School stimulus money". Pittsburgh Post-Gazette. March 12, 2009.
- Pennsylvania Department of Education (2007). "Common Cents program - Making Every Dollar Count".
- Pennsylvania Department of Education (2011). "Real Estate Tax Rates by School District 2011-12 Real Estate Mills".
- Pennsylvania Department of Education (2004). "Act 511 Tax Report".
- State Tax Equalization Board (2011). "State Tax Equalization Board About US". Archived from the original on 2012-11-14.
- Pennsylvania Auditor General office - Bureau of Audits (February 2011). "A Special Performance Audit of the Pennsylvania State Tax Equalization Boards" (PDF).
- Richland School District Administration, Richland School District Budget report, June 2015
- Pennsylvania Department of Education (2014). "Real Estate Tax Rates by School District 2013-14 Real Estate Mills".
- Pennsylvania Department of Education, Finances_Real Estate Tax Rates 2012-13, 2012
- Pennsylvania Department of Education (2011). "Real Estate Tax Millage by School District".
- Pennsylvania Department of Education (2010). "Real Estate Tax Millage by School District".
- Pennsylvania Department of Education (2010). "Financial Elements Reports".
- Pennsylvania Department of Education (2009). "Financial Elements Reports 2008-09 Real Estate Mills".
- Pennsylvania Department of Education (2008). "Real Estate Tax Millage by School District".
- Pennsylvania Department of Education, Real Estate Tax Millage by School District, 2006
- Pennsylvania Department of Education, Real Estate Tax Millage by School District, 2005
- Tax-rates.org., The 2015 Tax Resource County Property Taxes 2014, 2015
- Pennsylvania Department of Education, Pennsylvania School Finances - Summaries of Annual Financial Report Data 2010-11, 2011
- New Census Data on Property Taxes on Homeowners, Tax Foundation, September 22, 2009
- Tax Foundation, The facts on Pennsylvania’s Tax Climate, January 2015
- Pennsylvania Department of Education (2010). "2010-11 Act 1 of 2006 Referendum Exception Guidelines".
- Kaitlynn Riely (August 4, 2011). "Law could restrict school construction projects". Pittsburgh Post-Gazette.
- Pennsylvania General Assembly (June 2011). "SB330 of 2011".
- Pennsylvania Department of Education (May 2010). "Special Session Act 1 of 2006 School District Adjusted Index for 2006-2007 through 2010-2011".
- Pennsylvania Department of Education (May 2011). "2012-2013 School District Adjusted Index Listing".
- Pennsylvania Department of Education, 2013-2014 School District Adjusted Index, September 2012
- Pennsylvania Department of Education, 2014-2015 School District Adjusted Index, September 2013
- Pennsylvania Department of Education, 2015-2016 School District Adjusted Index, September 2014
- Pennsylvania School Employees, Retirement System, PSERS Chart showing payment mandates 2007-2020, 2014
- Pennsylvania Department of Education (April 30, 2014). "Report on Referendum Exceptions For School Year 2014-2015".
- Pennsylvania Department of Education (May 1, 2010). "SSAct1_Property Tax Relief Per HomeStead 2010".
- Pennsylvania Auditor General Office (February 23, 2010). "Special Report Pennsylvania Property Tax Relief".
- Tax Relief per Homestead 2009, Pennsylvania Department of Education Report May 1, 2010
- Commonwealth of Pennsylvania Department of Education. "Property Tax/Rent Rebate Program".
- Tax Foundation (September 22, 2009). "New Census Data on Property Taxes on Homeowners". Archived from the original on September 6, 2011.
- Richland School Board (2006). "Policy Manual Student Wellness Policy 246". Archived from the original on 2015-09-25.
- Probart C, McDonnell E, Weirich JE, Schilling L, Fekete V (September 2008). "Statewide assessment of local wellness policies in Pennsylvania public school districts". J Am Diet Assoc. 108 (9): 1497–502. doi:10.1016/j.jada.2008.06.429. PMID 18755322.
- Pennsylvania Department of Education – Division of Food and Nutrition (July 2008). "Nutrition Standards for Competitive Foods in Pennsylvania Schools for the School Nutrition Incentive".
- USDA, Child Nutrition Programs - Eligibility Manual for School Meals, 2012
- Pennsylvania Hunger Action Center, The Pennsylvania School Breakfast Report Card, 2009
- USDA, Child Nutrition Programs, June 27, 2013
- United States Department of Agriculture (2011). "Food and Nutrition Service Equity in School Lunch Pricing Fact Sheet" (PDF). Archived from the original (PDF) on September 22, 2013.
- Denver Nicks (February 25, 2014). "White House Sets New Limits on Junk Food Ads in Schools". Time Magazine.
- USDA Food and Nutrition Service (2014). "School Meals FAQ".
- Monica Eng (November 26, 2012). "Lactose intolerance: When drinking school milk makes students feel sick". Chicago Tribune.
- Pennsylvania State Department of Health (2010). "Pennsylvania Bulletin Doc. No. 10-984 School Immunizations; Communicable and Noncommunicable Diseases".
- Pennsylvania Department of Health (2014). "School Immunization Requirements".
- Pennsylvania Department of Health (2014). "Mandated School Health Screenings". Archived from the original on 2015-06-07.
- Richland School District (2015). "Richland School District Athletics". Archived from the original on 2015-09-11.
- Pennsylvania Department of Education (2013). "Interscholastic Athletic Opportunities Disclosure Form" (PDF).
- Pennsylvania Office of the Governor Press Release, Home-Schooled, Charter School Children Can Participate in School District Extracurricular Activities, November 10, 2005
- Eleanor Chute., New Pa. law expands clearance requirements for school volunteers, employees, Pittsburgh Post-Gazette, December 15, 2014
- Pennsylvania General Assembly (2014). "ACT 126 – Child Abuse Recognition and Reporting Act".
- Ali Stevens., Child Protective Services Law impacts schools, WKOK.com 1070AM, January 6, 2015
- PA General Assembly (July 1, 2012). "Senate Bill 200 of Session 2011 Safety in Youth Sports Act".
- UMPC Sports Medicine (2014). "Managing Concussions in Student Athletes: The Safety in Youth Sports Act".
- Richland School Board, Richland School District Teacher Union Contract, 2014
- Pennsylvania Interscholastic Athletics Association (2015). "PIAA School Directory".