Rodels
Rodels (Romansh: Roten) is a former municipality in the canton of Graubünden in Switzerland, located in the district of Hinterrhein. On 1 January 2015 the former municipalities of Almens, Paspels, Pratval, Rodels and Tomils merged to form the new municipality of Domleschg.[1]
Rodels | |
|---|---|
 | |
 Coat of arms | |
Location of Rodels 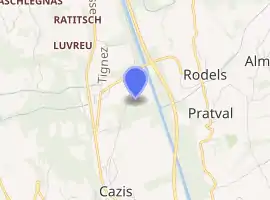
| |
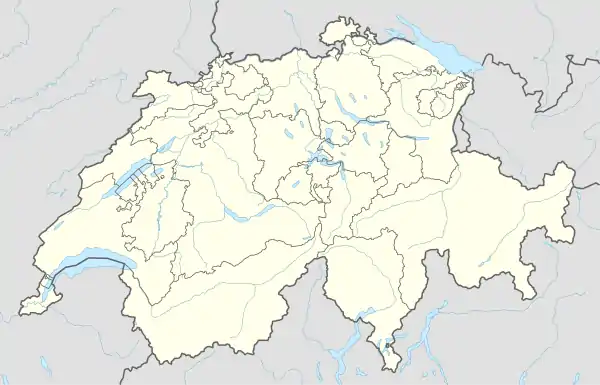 Rodels Rodels | |
| Coordinates: 46°44′N 9°26′E | |
| Country | Switzerland |
| Canton | Graubünden |
| District | Hinterrhein |
| Area | |
| • Total | 1.68 km2 (0.65 sq mi) |
| Elevation | 684 m (2,244 ft) |
| Population (Dec 2013) | |
| • Total | 267 |
| • Density | 160/km2 (410/sq mi) |
| Time zone | UTC+01:00 (Central European Time) |
| • Summer (DST) | UTC+02:00 (Central European Summer Time) |
| Postal code(s) | 7415 |
| SFOS number | 3636 |
| Surrounded by | Almens, Cazis, Paspels, Pratval |
| Website | www SFSO statistics |
History
Rodels is first mentioned in the mid-12th Century as ad Rautine.[2]
Geography
Before the merger, Rodels had a total area of 1.7 km2 (0.66 sq mi).[3] Of this area, 52.4% is used for agricultural purposes, while 31.5% is forested. Of the rest of the land, 11.3% is settled (buildings or roads) and the remainder (4.8%) is non-productive (rivers, glaciers or mountains).[3]
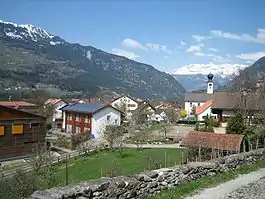
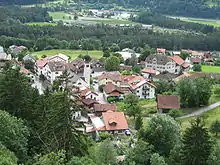
The former municipality is located in the Domleschg sub-district, of the Hinterrhein district. It consists of a linear village and a haufendorf (an irregular, unplanned and quite closely packed village, built around a central square) as well as the hamlet of Nueins. The municipality is located on a low terrace on the right side of the Hinterrhein.
Demographics
Rodels had a population (as of 2013) of 267.[3] As of 2013, 7.9% of the population was made up of foreign nationals. Between 2000 and 2010, the population number was stable.[4] Between 2010 and 2013, the population has declined by 5%.[3]
As of 2000, the gender distribution of the population was 50.8% male and 49.2% female.[5] The age distribution, as of 2000, in Rodels is; 35 people or 12.5% of the population are between 0 and 9 years old. 27 people or 9.6% are 10 to 14, and 17 people or 6.0% are 15 to 19. Of the adult population, 34 people or 12.1% of the population are between 20 and 29 years old. 52 people or 18.5% are 30 to 39, 46 people or 16.4% are 40 to 49, and 28 people or 10.0% are 50 to 59. The senior population distribution is 18 people or 6.4% of the population are between 60 and 69 years old, 16 people or 5.7% are 70 to 79, there are 7 people or 2.5% who are 80 to 89, and there are 1 people or 0.4% who are 90 to 99.[6]
In the 2011 federal election the most popular party was the SVP which received 23.6% of the vote. The next three most popular parties were the BDP (22.1%), SPS (17.8%) and the CVP (15.5%).[3]
In Rodels 80% of the population (between age 25-64) have completed either non-mandatory upper secondary education or additional higher education (either university or a Fachhochschule).[4]
As of 2011, Rodels had an unemployment rate of 1.05%.[3] As of 2008, there were 20 people employed in the primary economic sector and about 8 businesses involved in this sector. 6 people are employed in the secondary sector. 23 people are employed in the tertiary sector, with 15 businesses in this sector.[3]
The historical population is given in the following table:[2]
| year | population |
|---|---|
| 1803 | 106 |
| 1850 | 135 |
| 1900 | 147 |
| 1950 | 178 |
| 1980 | 155 |
| 2000 | 281 |
Languages
Most of the population (as of 2000) speaks German (90.7%), with Romansh being second most common (3.9%) and Italian being third (1.8%).[4]
| Languages in Rodels | ||||||
| Languages | Census 1980 | Census 1990 | Census 2000 | |||
| Number | Percent | Number | Percent | Number | Percent | |
| German | 125 | 80.65% | 204 | 91.89% | 255 | 90.75% |
| Romanish | 25 | 16.13% | 10 | 4.50% | 11 | 3.91% |
| Italian | 5 | 3.23% | 5 | 2.25% | 5 | 1.78% |
| Population | 155 | 100% | 222 | 100% | 281 | 100% |
Transportation
Rhaetian Railway operate services to Rodels-Realta (Rhaetian Railway station) nearby.
References
- Amtliches Gemeindeverzeichnis der Schweiz published by the Swiss Federal Statistical Office (in German) accessed 2 January 2013
- Rodels in German, French and Italian in the online Historical Dictionary of Switzerland.
- Swiss Federal Statistical Office - Regional portraits 2015: Communes accessed 01 April 2020
- Swiss Federal Statistical Office - Regional portraits 2012: Communes accessed 01 April 2020
- Graubunden in Numbers Archived 2009-09-24 at the Wayback Machine (in German) accessed 21 September 2009
- Graubunden Population Statistics Archived 2009-08-27 at the Wayback Machine (in German) accessed 21 September 2009
| Wikimedia Commons has media related to Rodels. |