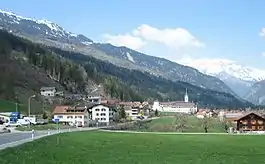
Cazis
Cazis (Romansh: Tgazas) is a municipality in the Viamala Region in the Swiss canton of Graubünden. On 1 January 2010 the municipalities of Portein, Präz, Sarn and Tartar merged into the municipality of Cazis.[3]
Cazis | |
|---|---|
 | |
 Coat of arms | |
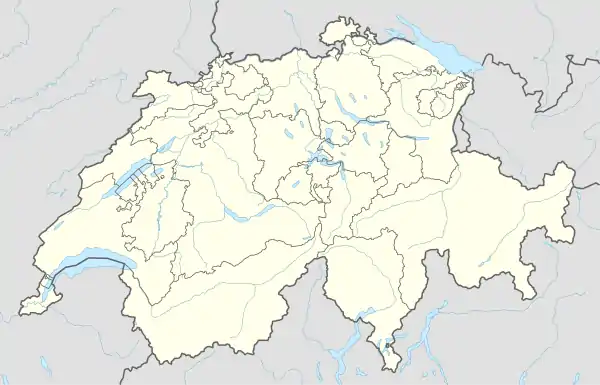
Location of Cazis 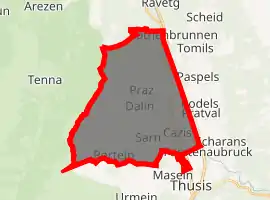
| |
 Cazis Cazis | |
| Coordinates: 46°43′N 9°25′E | |
| Country | Switzerland |
| Canton | Graubünden |
| District | Viamala |
| Government | |
| • Mayor | Eduard Decurtins |
| Area | |
| • Total | 31.18 km2 (12.04 sq mi) |
| Elevation | 659 m (2,162 ft) |
| Population (2018-12-31)[2] | |
| • Total | 2,223 |
| • Density | 71/km2 (180/sq mi) |
| Time zone | UTC+01:00 (Central European Time) |
| • Summer (DST) | UTC+02:00 (Central European Summer Time) |
| Postal code(s) | 7408 |
| SFOS number | 3661 |
| Surrounded by | Fürstenau, Masein, Paspels, Pratval, Rhäzüns, Rodels, Rothenbrunnen, Thusis, Tumegl/Tomils |
| Website | www SFSO statistics |
History
Cazis is first mentioned in 926 as Cacias.[4]
Geography
Cazis has an area, as of 2006, of 7.3 km2 (2.8 sq mi). Of this area, 41% is used for agricultural purposes, while 41.1% is forested. Of the rest of the land, 13.6% is settled (buildings or roads) and the remainder (4.3%) is non-productive (rivers, glaciers or mountains).[5]
Before 2017, the municipality was located in the Thusis sub-district, of the Heinzenberg district, after 2017 it was part of the Viamala Region.[6] It is located on the western side of the Hinterrhein valley. It consists of the linear village of Cazis and the hamlets of Ober- and Unterrealta, Luvreu, Ratitsch, Summaprada, Schauenberg and Valleina. The municipalities of Cazis, Portein, Präz, Sarn, and Tartar merged on 1 January 2010 into a new municipality that will be known as Cazis.
Demographics
Cazis has a population (as of 31 December 2019) of 2,264.[7] As of 2008, 14.8% of the population was made up of foreign nationals. Over the last 10 years the population has grown at a rate of 7.4%.[5]
As of 2000, the gender distribution of the population was 48.2% male and 51.8% female.[8] The age distribution, as of 2000, in Cazis is; 180 people or 11.4% of the population are between 0 and 9 years old. 86 people or 5.5% are 10 to 14, and 126 people or 8.0% are 15 to 19. Of the adult population, 160 people or 10.2% of the population are between 20 and 29 years old. 274 people or 17.4% are 30 to 39, 255 people or 16.2% are 40 to 49, and 199 people or 12.6% are 50 to 59. The senior population distribution is 131 people or 8.3% of the population are between 60 and 69 years old, 87 people or 5.5% are 70 to 79, there are 67 people or 4.3% who are 80 to 89, and there are 10 people or 0.6% who are 90 to 99.[9]
In the 2007 federal election the most popular party was the SVP which received 33.3% of the vote. The next three most popular parties were the CVP (29.6%), the SPS (22.3%) and the FDP (13.4%).[5]
The entire Swiss population is generally well educated. In Cazis about 64.5% of the population (between age 25-64) have completed either non-mandatory upper secondary education or additional higher education (either University or a Fachhochschule).[5]
Cazis has an unemployment rate of 1.09%. As of 2005, there were 69 people employed in the primary economic sector and about 19 businesses involved in this sector. 150 people are employed in the secondary sector and there are 16 businesses in this sector. 564 people are employed in the tertiary sector, with 42 businesses in this sector.[5]
From the 2000 census, 840 or 53.3% are Roman Catholic, while 488 or 31.0% belonged to the Swiss Reformed Church. Of the rest of the population, there are 55 individuals (or about 3.49% of the population) who belong to the Orthodox Church, and there are 12 individuals (or about 0.76% of the population) who belong to another Christian church. There are 25 (or about 1.59% of the population) who are Islamic. There are 53 individuals (or about 3.37% of the population) who belong to another church (not listed on the census), 64 (or about 4.06% of the population) belong to no church, are agnostic or atheist, and 38 individuals (or about 2.41% of the population) did not answer the question.[9]
The historical population is given in the following table:[4]
| year | population |
|---|---|
| 1803 | 420 |
| 1850 | 755 |
| 1900 | 738 |
| 1950 | 1,441 |
| 1970 | 1,687 |
| 2000 | 1,575 |
Languages
Until 1800, the municipality spoke exclusively Sursilvan, a dialect of Romansh.
Today, the municipality is predominantly German-speaking population, with small Romansh- and Italian-speaking minorities. Most of the population (as of 2000) speaks German (84.2%), with Romansh being second most common ( 4.7%) and Italian being third ( 2.7%).[5]
| Languages in Cazis | ||||||
| Language | Census of 1980 | Census of 1990 | Census of 2000 | |||
| Number | Percentage | Number | Percentage | Number | Percentage | |
| German | 1166 | 79.37% | 1276 | 87.52% | 1326 | 91.89% |
| Romansh | 191 | 13.00% | 101 | 6.93% | 74 | 5.13% |
| Italian | 112 | 7.62% | 81 | 5.56% | 43 | 2.98% |
| Population | 1469 | 100% | 1458 | 100% | 1443 | 100% |
Heritage sites of national significance
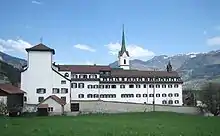
The Cresta (prehistoric settlement), Chapel St. Wendelin and the Catholic Church of St. Martin are listed as Swiss heritage sites of national significance.[10]
Transportation
The municipality has three railway stations: Cazis, Rodels-Realta, and Rothenbrunnen. All three are located on the Landquart–Thusis line with regular service to Chur and St. Moritz.
References
- "Arealstatistik Standard - Gemeinden nach 4 Hauptbereichen". Federal Statistical Office. Retrieved 13 January 2019.
- "Ständige Wohnbevölkerung nach Staatsangehörigkeitskategorie Geschlecht und Gemeinde; Provisorische Jahresergebnisse; 2018". Federal Statistical Office. 9 April 2019. Retrieved 11 April 2019.
- Amtliches Gemeindeverzeichnis der Schweiz, Mutationsmeldungen 2009 / Répertoire officiel des communes de Suisse, Mutations 2009 / Elenco ufficiale dei Comuni della Svizzera, Mutazione 2009 (PDF) (Report). Federal Statistical Office. 2009. nden. Archived from the original (PDF) on 18 November 2010. Retrieved 6 March 2010.
- Cazis in German, French and Italian in the online Historical Dictionary of Switzerland.
- Swiss Federal Statistical Office Archived January 5, 2016, at the Wayback Machine accessed 7 October 2009
- Swiss Federal Statistical Office - Amtliches Gemeindeverzeichnis der Schweiz - Mutationsmeldungen 2016 accessed 16 February 2017
- "Ständige und nichtständige Wohnbevölkerung nach institutionellen Gliederungen, Geburtsort und Staatsangehörigkeit". bfs.admin.ch (in German). Swiss Federal Statistical Office - STAT-TAB. 31 December 2019. Retrieved 6 October 2020.
- Graubunden in Numbers Archived September 24, 2009, at the Wayback Machine (in German) accessed 21 September 2009
- Graubunden Population Statistics Archived August 27, 2009, at the Wayback Machine (in German) accessed 21 September 2009
- Swiss inventory of cultural property of national and regional significance Archived May 1, 2009, at the Wayback Machine 21 November 2008 version, (in German) accessed 7 October 2009
| Wikimedia Commons has media related to Cazis. |
