Saarlouis (electoral district)
Saarlouis is an electoral constituency (German: Wahlkreis) represented in the Bundestag. It elects one member via first-past-the-post voting. Under the current constituency numbering system, it is designated as constituency 297. It is located in western Saarland, comprising the Merzig-Wadern district and most of the district of Saarlouis district.[1]
| 297 Saarlouis | |
|---|---|
| electoral district for the Bundestag | |
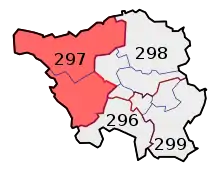 Saarlouis in 2009 | |
| State | Saarland |
| Population | 265,500 (2015) |
| Electorate | 207,501 (2017) |
| Major settlements | Saarlouis Merzig Dillingen |
| Area | 891.4 km2 |
| Current electoral district | |
| Created | 1957 |
| Party | CDU |
| Member | Peter Altmaier |
| Elected | 2009, 2013, 2017 |
Saarlouis was created for the inaugural 1957 federal election after the accession of Saarland to Germany. Since 2009, it has been represented by Peter Altmaier of the Christian Democratic Union (CDU).[2]
Geography
Saarlouis is located in western Saarland. As of the 2021 federal election, it comprises the Merzig-Wadern district and the Saarlouis district excluding the Lebach and Schmelz municipalities.[1]
History
Saarlouis was created in 1957, then known as Saarlouis – Merzig. It acquired its current name in the 1965 election. In the 1957 and 1961 elections, it was constituency 245 in the numbering system. In the 1965 through 1998 elections, it was number 246. Since the 2002 election, it has been number 297.
Originally, the constituency comprised the Merzig-Wadern district and the Saarlouis district excluding the Ämter of Bous/Saar, Lebach, Schmelz, and Wadgassen. In the 1965 through 1972 elections, it lost the municipality of Schwalbach from the Saarlouis district district. In the 1976 through 1998 elections, it acquired a configuration similar to its current borders, but lacking the municipalities of Bous, Ensdorf, Schwalbach, and Wadgassen from the Saarlouis district. It acquired its current borders in the 2002 election.
| Election | No. | Name | Borders |
|---|---|---|---|
| 1957 | 245 | Saarlouis – Merzig |
|
| 1961 | |||
| 1965 | 246 | Saarlouis |
|
| 1969 | |||
| 1972 | |||
| 1976 |
| ||
| 1980 | |||
| 1983 | |||
| 1987 | |||
| 1990 | |||
| 1994 | |||
| 1998 | |||
| 2002 | 297 |
| |
| 2005 | |||
| 2009 | |||
| 2013 | |||
| 2017 | |||
| 2021 |
Members
The constituency was first represented by Albert Baldauf of the Christian Democratic Union (CDU) from 1957 to 1965, followed by fellow CDU member Josef Schmitt from 1965 to 1976. Hans-Werner Müller of the CDU was then representative from 1976 to 1990. Ottmar Schreiner of the Social Democratic Party (SPD) was elected in 1990 and served until 2009. Peter Altmaier of the CDU has been representative since 2009.
| Election | Member | Party | % | |
|---|---|---|---|---|
| 1957 | Albert Baldauf | CDU | 44.4 | |
| 1961 | 58.2 | |||
| 1965 | Josef Schmitt | CDU | 54.2 | |
| 1969 | 53.4 | |||
| 1972 | 48.6 | |||
| 1976 | Hans-Werner Müller | CDU | 50.4 | |
| 1980 | 47.5 | |||
| 1983 | 51.2 | |||
| 1987 | 45.6 | |||
| 1990 | Ottmar Schreiner | SPD | 50.0 | |
| 1994 | 49.0 | |||
| 1998 | 55.1 | |||
| 2002 | 50.6 | |||
| 2005 | 40.4 | |||
| 2009 | Peter Altmaier | CDU | 37.5 | |
| 2013 | 44.5 | |||
| 2017 | 38.0 | |||
Election results
2017 election
| Federal election (2017): Saarlouis[3] | |||||||||
|---|---|---|---|---|---|---|---|---|---|
| Notes: |
Blue background denotes the winner of the electorate vote.
| ||||||||
| Party | Candidate | Votes | % | ±% | Party votes | % | ±% | ||
| CDU | 60,102 | 38.0 | 52,981 | 33.6 | |||||
| SPD | Heiko Maas | 50,672 | 32.1 | 42,476 | 27.0 | ||||
| Left | Marilyn Heib | 17,142 | 10.8 | 20,320 | 12.9 | ||||
| AfD | Irene Lienshöft | 14,224 | 9.0 | 15,506 | 9.8 | ||||
| FDP | Kirsten Cortez de Lobao | 6,069 | 3.8 | 12,059 | 7.7 | ||||
| Green | Markus Tressel | 5,532 | 3.5 | 8,598 | 5.5 | ||||
| PARTEI | Michael Kiefer | 1,741 | 1.1 | 1,751 | 1.1 | ||||
| FW | Uwe Andreas Kammer | 1,352 | 0.9 | 1,243 | 0.8 | ||||
| Pirates | Lea Magdalena Laux | 939 | 0.6 | 799 | 0.5 | ||||
| NPD | 748 | 0.5 | |||||||
| V-Partei³ | 461 | 0.3 | |||||||
| PDV | Michael Bienek | 242 | 0.2 | 201 | 0.1 | ||||
| BGE | 197 | 0.1 | |||||||
| DM | 185 | 0.2 | |||||||
| MLPD | 80 | 0.1 | |||||||
| Informal votes | 2,415 | 2,825 | |||||||
| Total Valid votes | 158,015 | 157,605 | |||||||
| Turnout | 160,430 | 77.3 | |||||||
| CDU hold | Majority | 9,430 | 5.9 | ||||||
2013 election
| Federal election (2013): Saarlouis[4] | |||||||||
|---|---|---|---|---|---|---|---|---|---|
| Notes: |
Blue background denotes the winner of the electorate vote.
| ||||||||
| Party | Candidate | Votes | % | ±% | Party votes | % | ±% | ||
| CDU | 66,694 | 44.5 | 60,052 | 40.1 | |||||
| SPD | Reinhold Jost | 52,303 | 34.9 | 46,037 | 30.7 | ||||
| Left | Wolfgang Schumacher | 10,936 | 7.3 | 13,458 | 9.0 | ||||
| AfD | Heinrich Adams | 6,418 | 4.3 | 7,645 | 5.1 | ||||
| Green | Markus Tressel | 5,577 | 3.7 | 7,873 | 5.3 | ||||
| Pirates | Michael Klein | 3,652 | 2.4 | 3,739 | 2.5 | ||||
| NPD | Frank Franz | 2,475 | 1.7 | 2,610 | 1.7 | ||||
| FDP | Wolfgang Krichel | 1,872 | 1.2 | 5,480 | 3.7 | ||||
| FAMILIE | 1,653 | 1.1 | |||||||
| FW | 1,075 | 0.7 | |||||||
| PRO | 237 | 0.2 | |||||||
| MLPD | 71 | 0.0 | |||||||
| Informal votes | 4,360 | 4,357 | |||||||
| Total Valid votes | 149,927 | 149,930 | |||||||
| Turnout | 154,287 | 72.9 | |||||||
| CDU hold | Majority | 14,391 | 9.6 | ||||||
2009 election
| Federal election (2009): Saarlouis[5] | |||||||||
|---|---|---|---|---|---|---|---|---|---|
| Notes: |
Blue background denotes the winner of the electorate vote.
| ||||||||
| Party | Candidate | Votes | % | ±% | Party votes | % | ±% | ||
| CDU | Peter Altmaier | 58,297 | 37.5 | 50,566 | 32.4 | ||||
| SPD | 51,193 | 32.9 | 37,749 | 24.2 | |||||
| Left | Alfred Pfannebecker | 24,244 | 15.6 | 31,057 | 19.9 | ||||
| FDP | Sebastian Greiber | 11,516 | 7.4 | 19,643 | 12.6 | ||||
| Green | Claudia Beck | 8,342 | 5.4 | 10,194 | 6.5 | ||||
| Pirates | 2,188 | 1.4 | |||||||
| FAMILIE | 2,013 | 1.3 | |||||||
| NPD | Aloys Lehmler | 2,025 | 1.3 | 1,874 | 1.2 | ||||
| RRP | 861 | 0.6 | |||||||
| MLPD | 48 | 0.0 | |||||||
| Informal votes | 4,022 | 3,446 | |||||||
| Total Valid votes | 155,617 | 156,193 | |||||||
| Turnout | 159,639 | 74.3 | |||||||
| CDU gain from SPD | Majority | 7,104 | 4.6 | ||||||
References
- "Constituency Saarlouis". Federal Returning Officer.
- "Results for Saarlouis". Federal Returning Officer.
- Results for Saarlouis
- Results for Saarlouis
- Results for Saarlouis
| Current | |
|---|---|
| Other states |
|
| See also | |