Sample (statistics)
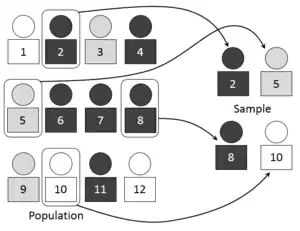
In statistics and quantitative research methodology, a sample is a set of individuals or objects collected or selected from a statistical population by a defined procedure.[1] The elements of a sample are known as sample points, sampling units or observations. When conceived as a data set, a sample is often denoted by capital roman letters such and , with its elements expressed in lower-case (e.g., ) and the sample size denoted by the letter .[2][3]

Typically, the population is very large, making a census or a complete enumeration of all the individuals in the population either impractical or impossible. The sample usually represents a subset of manageable size. Samples are collected and statistics are calculated from the samples, so that one can make inferences or extrapolations from the sample to the population.
The sample may be drawn from a population without replacement (i.e. no element can be selected more than once in the same sample), in which case it is a subset of a population; or with replacement (i.e. an element may appear multiple times in the one sample), in which case it is a multisubset.[4]
Kinds of samples
A complete sample is a set of objects from a parent population that includes all such objects that satisfy a set of well-defined selection criteria.[5] For example, a complete sample of Australian men taller than 2 m would consist of a list of every Australian male taller than 2 m. But it wouldn't include German males, or tall Australian females, or people shorter than 2 m. So to compile such a complete sample requires a complete list of the parent population, including data on height, gender, and nationality for each member of that parent population. In the case of human populations, such a complete list is unlikely to exist (the human population being in the billions). But such complete samples are often available in other disciplines, such as the set of players in a major sports league, the birth dates of the members of a parliament, or a complete magnitude-limited list of astronomical objects.
An unbiased (representative) sample is a set of objects chosen from a complete sample, using a selection process that does not depend on the properties of the objects.[6] For example, an unbiased sample of Australian men taller than 2 m might consist of a randomly sampled subset of 1% of Australian males taller than 2 m. But one chosen from the electoral register might not be unbiased since, for example, males aged under 18 will not be on the electoral register. In an astronomical context, an unbiased sample might consist of that fraction of a complete sample for which data are available, provided the data availability is not biased by individual source properties.
The best way to avoid a biased or unrepresentative sample is to select a random sample, also known as a probability sample. A random sample is defined as a sample where each individual member of the population has a known, non-zero chance of being selected as part of the sample.[7] Several types of random samples are simple random samples, systematic samples, stratified random samples, and cluster random samples.
A sample that is not random is called a non-random sample or a non-probability sampling.[8] Some examples of nonrandom samples are convenience samples, judgment samples, purposive samples, quota samples, snowball samples, and quadrature nodes in quasi-Monte Carlo methods.
Mathematical description of random sample
In mathematical terms, given a probability distribution F, a random sample of length n (where n may be any positive integer) is a set of realizations of n independent, identically distributed (iid) random variables with distribution F.[9]
A sample concretely represents the results of n experiments in which the same quantity is measured. For example, if we want to estimate the average height of members of a particular population, we measure the heights of n individuals. Each measurement is drawn from the probability distribution F characterizing the population, so each measured height is the realization of a random variable with distribution F. Note that a set of random variables (i.e., a set of measurable functions) must not be confused with the realizations of these variables (which are the values that these random variables take). In other words, is a function representing the measurement at the i-th experiment, and is the value obtained when making the measurement.
See also
Notes
- Peck, Roxy; Olsen, Chris & Devore, Jay (2008), Introduction to Statistics and Data Analysis (3rd ed.), Belmont, Cal.: Thomson Brooks/Cole, p. 8, ISBN 978-0-495-11873-2, LCCN 2006933904, retrieved 2009-08-04
- "List of Probability and Statistics Symbols". Math Vault. 2020-04-26. Retrieved 2020-08-21.
- "What Is the Meaning of Sample Size?". Sciencing. Retrieved 2020-08-21.
- Borzyszkowski, Andrzej M.; Sokołowski, Stefan, eds. (1993), "A characterization of Sturmian morphisms" (PDF), Mathematical Foundations of Computer Science 1993. 18th International Symposium, MFCS'93 Gdańsk, Poland, August 30–September 3, 1993 Proceedings, Lecture Notes in Computer Science, 711, pp. 281–290, CiteSeerX 10.1.1.361.7021, doi:10.1007/3-540-57182-5_20, ISBN 978-3-540-57182-7, Zbl 0925.11026
- Pratt, J. W., Raiffa, H., and Schaifer, R. (1995). Introduction to Statistical Decision Theory. Cambridge, Mass.: MIT Press. ISBN 9780262161442. MR1326829
- Lomax, R. G. and Hahs-Vaughan, Debbie L. An introduction to statistical concepts (3rd ed).
- Cochran, William G. (1977). Sampling techniques (Third ed.). Wiley. ISBN 978-0-471-16240-7.
- Johan Strydom (2005). Introduction to Marketing (Third ed.). Wiley. ISBN 978-0-471-16240-7.
- Samuel S. Wilks, Mathematical Statistics, John Wiley, 1962, Section 8.1