Somerton and Frome (UK Parliament constituency)
Somerton and Frome is a constituency[n 1] represented in the House of Commons of the UK Parliament since 2015 by David Warburton of the Conservative Party.[n 2]
| Somerton and Frome | |
|---|---|
| County constituency for the House of Commons | |
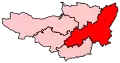 Boundary of Somerton and Frome in Somerset | |
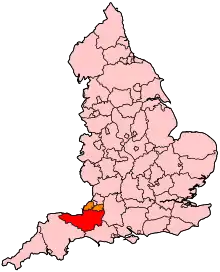 Location of Somerset within England | |
| County | Somerset |
| Electorate | 82,150 (December 2010)[1] |
| Major settlements | Frome, Somerton, Wincanton and Bruton |
| Current constituency | |
| Created | 1983 |
| Member of Parliament | David Warburton (Conservative) |
| Number of members | One |
| Created from | Wells and Yeovil[2] |
Boundaries
1983–1997: The District of Yeovil wards of Blackmoor Vale, Brue, Burrow Hill, Camelot, Cary, Curry Rivel, Islemoor, Ivelchester, Langport and Huish, Martock, Milborne Port, Northstone, Turn Hill, Wessex, and Wincanton, and the District of Mendip wards of Beacon, Beckington and Rode, Coleford, Creech, Frome Badcox, Frome Fromefield, Frome Keyford, Mells, Nordinton, Postlebury, Selwood and Berkley, Stratton, and Vale.
1997–2010: The District of South Somerset wards of Blackmoor Vale, Brue, Burrow Hill, Camelot, Cary, Curry Rivel, Islemoor, Ivelchester, Langport and Huish, Martock, Milborne Port, Northstone, Turn Hill, Wessex, and Wincanton, and the District of Mendip wards of Beacon, Beckington and Rode, Coleford, Creech, Frome Badcox, Frome Fromefield, Frome Keyford, Frome Welshmill, Mells, Nordinton, Postlebury, Stratton, and Vale.
2010–present: The District of South Somerset wards of Blackmoor Vale, Bruton, Burrow Hill, Camelot, Cary, Curry Rivel, Islemoor, Langport and Huish, Martock, Milborne Port, Northstone, Tower, Turn Hill, Wessex, and Wincanton, and the District of Mendip wards of Beacon, Beckington and Rode, Coleford, Creech, Frome Berkley Down, Frome Fromefield, Frome Keyford, Frome Park, Frome Welshmill, Mells, Nordinton, Postlebury, Stratton, and Vale.
The constituency was created in 1983 from parts of the seat of Wells. It covers the east of the district of Mendip and the north of the district of South Somerset.
Constituency profile
This area has a mixed economy, including agriculture and, in November 2012, had below the national average proportion of jobseekers (3.8%) at 1.6% of the population.[3]
Members of Parliament
| Election | Member[4] | Party | |
|---|---|---|---|
| 1983 | Robert Boscawen | Conservative | |
| 1992 | Mark Robinson | Conservative | |
| 1997 | David Heath | Liberal Democrat | |
| 2015 | David Warburton | Conservative | |
Elections
Elections in the 2010s
| Party | Candidate | Votes | % | ±% | |
|---|---|---|---|---|---|
| Conservative | David Warburton | 36,230 | 55.8 | –0.9 | |
| Liberal Democrats | Adam Boyden | 17,017 | 26.2 | +5.3 | |
| Labour | Sean Dromgoole | 8,354 | 12.9 | –4.3 | |
| Green | Andrea Dexter | 3,295 | 5.1 | +1.4 | |
| Majority | 19,213 | 29.6 | –6.2 | ||
| Turnout | 64,896 | 75.6 | –0.2 | ||
| Conservative hold | Swing | –3.1 | |||
| Party | Candidate | Votes | % | ±% | |
|---|---|---|---|---|---|
| Conservative | David Warburton | 36,231 | 56.7 | +3.7 | |
| Liberal Democrats | Mark Blackburn | 13,325 | 20.9 | +1.5 | |
| Labour | Sean Dromgoole | 10,998 | 17.2 | +9.9 | |
| Green | Theo Simon | 2,347 | 3.7 | –5.3 | |
| Independent | Richard Hadwin | 991 | 1.6 | +1.6 | |
| Majority | 22,906 | 35.8 | +2.3 | ||
| Turnout | 63,892 | 75.8 | +3.6 | ||
| Conservative hold | Swing | +2.4 | |||
| Party | Candidate | Votes | % | ±% | |
|---|---|---|---|---|---|
| Conservative | David Warburton | 31,960 | 53.0 | +8.5 | |
| Liberal Democrats | David Rendel | 11,692 | 19.4 | −28.1 | |
| UKIP | Alan Dimmick | 6,439 | 10.7 | +7.5 | |
| Green | Theo Simon | 5,434 | 9.0 | +9.0 | |
| Labour | David Oakensen | 4,419 | 7.3 | +2.9 | |
| Independent | Ian Angell | 365 | 0.6 | +0.6 | |
| Majority | 20,268 | 33.6 | N/A | ||
| Turnout | 60,309 | 72.2 | −2.1 | ||
| Conservative gain from Liberal Democrats | Swing | +18.3 | |||
| Party | Candidate | Votes | % | ±% | |
|---|---|---|---|---|---|
| Liberal Democrats | David Heath | 28,793 | 47.5 | +3.8 | |
| Conservative | Annunziata Rees-Mogg | 26,976 | 44.5 | +1.9 | |
| Labour | David Oakensen | 2,675 | 4.4 | −6.4 | |
| UKIP | Barry Harding | 1,932 | 3.2 | +1.3 | |
| Independent | Niall Warry | 236 | 0.4 | +0.4 | |
| Majority | 1,817 | 3.0 | +1.5 | ||
| Turnout | 60,612 | 74.3 | +5.1 | ||
| Liberal Democrats hold | Swing | +0.9 | |||
Elections in the 2000s
| Party | Candidate | Votes | % | ±% | |
|---|---|---|---|---|---|
| Liberal Democrats | David Heath | 23,759 | 43.9 | +0.3 | |
| Conservative | Clive Allen | 22,947 | 42.4 | 0.0 | |
| Labour | Joseph Pestell | 5,865 | 10.8 | −0.8 | |
| UKIP | Bill Lukins | 1,047 | 1.9 | +0.2 | |
| Veritas | Carl Beaman | 484 | 0.9 | N/A | |
| Majority | 812 | 1.5 | +0.3 | ||
| Turnout | 54,102 | 70.7 | +1.4 | ||
| Liberal Democrats hold | Swing | +0.2 | |||
| Party | Candidate | Votes | % | ±% | |
|---|---|---|---|---|---|
| Liberal Democrats | David Heath | 22,983 | 43.6 | +4.1 | |
| Conservative | Jonathan Marland | 22,315 | 42.4 | +3.1 | |
| Labour | Andy Perkins | 6,113 | 11.6 | −4.7 | |
| UKIP | Peter Bridgwood | 919 | 1.7 | +1.2 | |
| Liberal | Jean Pollock | 354 | 0.7 | N/A | |
| Majority | 668 | 1.2 | +1.0 | ||
| Turnout | 52,684 | 69.3 | −8.0 | ||
| Liberal Democrats hold | Swing | ||||
Elections in the 1990s
| Party | Candidate | Votes | % | ±% | |
|---|---|---|---|---|---|
| Liberal Democrats | David Heath | 22,684 | 39.5 | −0.7 | |
| Conservative | Mark Robinson | 22,554 | 39.3 | −8.2 | |
| Labour | Robert Ashford | 9,385 | 16.3 | +5.9 | |
| Referendum | Robert Rodwell | 2,449 | 4.3 | N/A | |
| UKIP | R.P. Gadd | 331 | 0.6 | N/A | |
| Majority | 130 | 0.2 | N/A | ||
| Turnout | 57,403 | 77.3 | −5.4 | ||
| Liberal Democrats gain from Conservative | Swing | ||||
| Party | Candidate | Votes | % | ±% | |
|---|---|---|---|---|---|
| Conservative | Mark Robinson | 28,052 | 47.5 | −6.2 | |
| Liberal Democrats | David Heath | 23,711 | 40.2 | +3.9 | |
| Labour | Robert Ashford | 6,154 | 10.4 | +0.4 | |
| Green | Ms. LA Graham | 742 | 1.3 | N/A | |
| Liberal | Ms. J Pollock | 388 | 0.7 | N/A | |
| Majority | 4,341 | 7.3 | −10.2 | ||
| Turnout | 59,047 | 82.7 | +3.3 | ||
| Conservative hold | Swing | −5.1 | |||
Elections in the 1980s
| Party | Candidate | Votes | % | ±% | |
|---|---|---|---|---|---|
| Conservative | Robert Boscawen | 29,351 | 53.73 | -0.66 | |
| Liberal | R.G. Morgan | 19,813 | 36.27 | +0.47 | |
| Labour | I.S. Kelly | 5,461 | 10.00 | +0.19 | |
| Majority | 9,538 | 17.46 | -1.13 | ||
| Turnout | 54,625 | 79.43 | +2.7 | ||
| Conservative hold | Swing | -0.6 | |||
| Party | Candidate | Votes | % | ±% | |
|---|---|---|---|---|---|
| Conservative | Robert Boscawen | 26,988 | 54.39 | N/A | |
| SDP | N Hinton | 17,761 | 35.80 | N/A | |
| Labour | JB Osborn | 4,867 | 9.81 | N/A | |
| Majority | 9,227 | 18.59 | N/A | ||
| Turnout | 49,616 | 76.7 | N/A | ||
| Conservative win (new seat) | |||||
Notes and references
- Notes
- A county constituency (for the purposes of election expenses and type of returning officer)
- As with all constituencies, the constituency elects one Member of Parliament (MP) by the first past the post system of election at least every five years.
- References
- "Electorate Figures - Boundary Commission for England". 2011 Electorate Figures. Boundary Commission for England. 4 March 2011. Archived from the original on 6 November 2010. Retrieved 13 March 2011.
- "'Somerton and Frome', June 1983 up to May 1997". ElectionWeb Project. Cognitive Computing Limited. Retrieved 14 March 2016.
- Unemployment claimants by constituency The Guardian
- "Somerton and Frome". Guardian. Retrieved 17 September 2012.
- "Statement of Persons Nominated" (PDF).
- "Parliamentary Constituencies Election Results-Thursday, 8 June 2017" (PDF). South Somerset District Council. 9 June 2017. Retrieved 12 February 2019.
- "Election Data 2015". Electoral Calculus. Archived from the original on 17 October 2015. Retrieved 17 October 2015.
- "Somerton & Frome". Election 2015. BBC. Retrieved 8 June 2015.
- "UK Polling Report".
- "Somerton & Frome". Election 2010. BBC. Retrieved 1 October 2010.
- "Politics Resources". Election 1992. Politics Resources. 9 April 1992. Retrieved 2010-12-06.