South Eastern Metropolitan Region
South Eastern Metropolitan Region is one of the eight electoral regions of Victoria, Australia, which elects five members to the Victorian Legislative Council (also referred to as the upper house) by proportional representation. The region was created in 2006 following the 2005 reform of the Victorian Legislative Council.
| South Eastern Metropolitan Region Victoria—Legislative Council | |
|---|---|
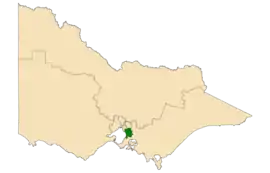 Location of South Eastern Metropolitan Region (dark green) in Victoria | |
| State | Victoria |
| Created | 2006 |
| MP | Lee Tarlamis (Labor) Tien Kieu (Labor) David Limbrick (Liberal Democrats) Gordon Rich-Phillips (Liberal) Adem Somyurek (Independent) |
| Party | Labor (2) Liberal (1) Liberal Democratic (1) Independent (1) |
| Electors | 499,435 (2018) |
| Area | 576 km2 (222.4 sq mi) |
| Demographic | Metropolitan |
| Coordinates | 38°3′S 145°13′E |
The region covers the outer south eastern suburbs of Melbourne, and comprises the Legislative Assembly districts of Carrum, Clarinda, Cranbourne, Dandenong, Frankston, Keysborough, Mordialloc, Mulgrave, Narre Warren North, Narre Warren South and Rowville.
Members
| Year | Member | Party | Member | Party | Member | Party | Member | Party | Member | Party | |||||
|---|---|---|---|---|---|---|---|---|---|---|---|---|---|---|---|
| 2006 | Gavin Jennings | Labor | Adem Somyurek | Labor | Bob Smith | Labor | Inga Peulich | Liberal | Gordon Rich-Phillips | Liberal | |||||
| 2010 | Lee Tarlamis | Labor | |||||||||||||
| 2014 | Nina Springle | Greens | |||||||||||||
| 2018 | Tien Kieu | Labor | David Limbrick | Liberal Democrats | |||||||||||
| 2020 | Lee Tarlamis | Labor | Independent | ||||||||||||
Returned MLCs by seat
Seats are allocated by single transferable vote using group voting tickets. Changes in party membership between elections have been omitted for simplicity.[1][2][3]
| Election | 1st MLC | 2nd MLC | 3rd MLC | 4th MLC | 5th MLC | |||||
|---|---|---|---|---|---|---|---|---|---|---|
| 2006 | Labor (Gavin Jennings) |
Liberal (Gordon Rich-Phillips) |
Labor (Adem Somyurek) |
Liberal (Inga Peulich) |
Labor (Bob Smith) | |||||
| 2010 | Labor (Gavin Jennings) |
Liberal (Gordon Rich-Phillips) |
Labor (Adem Somyurek) |
Liberal (Inga Peulich) |
Labor (Lee Tarlamis) | |||||
| 2014 | Labor (Gavin Jennings) |
Liberal (Gordon Rich-Phillips) |
Labor (Adem Somyurek) |
Liberal (Inga Peulich) |
Greens (Nina Springle) | |||||
| 2018 | Labor (Gavin Jennings) |
Labor (Adem Somyurek) |
Liberal (Gordon Rich-Phillips) |
Labor (Tien Kieu) |
Liberal Democrats (David Limbrick) | |||||
Election results
Liberal and Labor were defending two seats each. The Greens were defending one.[4]
| Party | Candidate | Votes | % | ±% | |
|---|---|---|---|---|---|
| Quota | 72,830 | ||||
| Labor | 1. Gavin Jennings (elected 1) 2. Adem Somyurek (elected 2) 3. Tien Kieu (elected 4) 4. Nessie Sayar 5. Ian Spencer |
218,209 | 49.93 | +9.83 | |
| Liberal | 1. Gordon Rich-Phillips (elected 3) 2. Inga Peulich 3. George Hua 4. Kuldeep Kaur 5. Robert Hicks |
126,615 | 28.97 | −6.24 | |
| Greens | 1. Nina Springle 2. Matthew Kirwan 3. Jacqueline Mitchell 4. Jake Vos 5. James Bennett |
24,390 | 5.58 | −0.71 | |
| Justice | 1. Peter Davy 2. Kerri Guy |
13,265 | 3.03 | +3.03 | |
| Animal Justice | 1. Elizabeth Johnston 2. Derrin Craig |
9,727 | 2.23 | +0.37 | |
| Democratic Labour | 1. Peter Stevens 2. Michael Palma |
6,396 | 1.46 | −0.76 | |
| Shooters, Fishers, Farmers | 1. Chris Banhidy 2. Vincent Leone |
6,326 | 1.45 | +0.21 | |
| Transport Matters | 1. Ali Khan 2. Chetan Sharma 3. Roona Fazal 4. Inderpal Singh 5. Deepakbir Kaur |
5,553 | 1.27 | +1.27 | |
| Health Australia | 1. Tamsin King 2. Carly Meaden |
3,722 | 0.85 | +0.85 | |
| Reason | 1. Laura Chipp 2. Brett Kagan |
3,719 | 0.85 | −1.82 | |
| Liberal Democrats | 1. David Limbrick (elected 5) 2. Matt Ford |
3,681 | 0.84 | −0.89 | |
| Sustainable Australia | 1. Anthony Cresswell 2. Daryl Budgeon |
3,028 | 0.69 | +0.69 | |
| Voluntary Euthanasia | 1. Kassandra Hall 2. Mardi Hill |
3,019 | 0.69 | +0.12 | |
| Aussie Battler | 1. David Armstrong 2. Michael Chamberlain |
2,822 | 0.65 | +0.65 | |
| Liberty Alliance | 1. David Maddison 2. Ralf Schumann |
2,314 | 0.53 | +0.53 | |
| Independent | 1. Tarang Chawla 2. Nicole Lee |
1,441 | 0.33 | +0.33 | |
| Victorian Socialists | 1. Aran Mylvaganam 2. Ben Reid |
1,239 | 0.28 | +0.28 | |
| Country | 1. Andrew Hepner 2. Marilyn Danieli |
1,202 | 0.28 | +0.28 | |
| Hudson for Northern Victoria | 1. Jannette Sinclair 2. Holly Madill |
402 | 0.09 | +0.09 | |
| Independent | 1. Stewart Hine | 62 | 0.01 | +0.01 | |
| Independent | 1. Bobby Singh | 49 | 0.01 | +0.01 | |
| Independent | 1. Peter Mack | 27 | 0.01 | +0.01 | |
| Total formal votes | 436,977 | 95.86 | −0.25 | ||
| Informal votes | 18,962 | 4.16 | +0.25 | ||
| Turnout | 455,939 | 89.77 | −3.10 | ||
References
- "State Election 2006 : Eastern Victorian Region". Victorian Electoral Commission.
- "State Election 2010 : Eastern Victorian Region". Victorian Electoral Commission.
- "State Election 2014 : Eastern Victorian Region". Victorian Electoral Commission.
- "State Election 2018: South-Eastern Metropolitan Region results summary - Victorian Electoral Commission". www.vec.vic.gov.au. Retrieved 13 December 2018.